StocksCorrelation
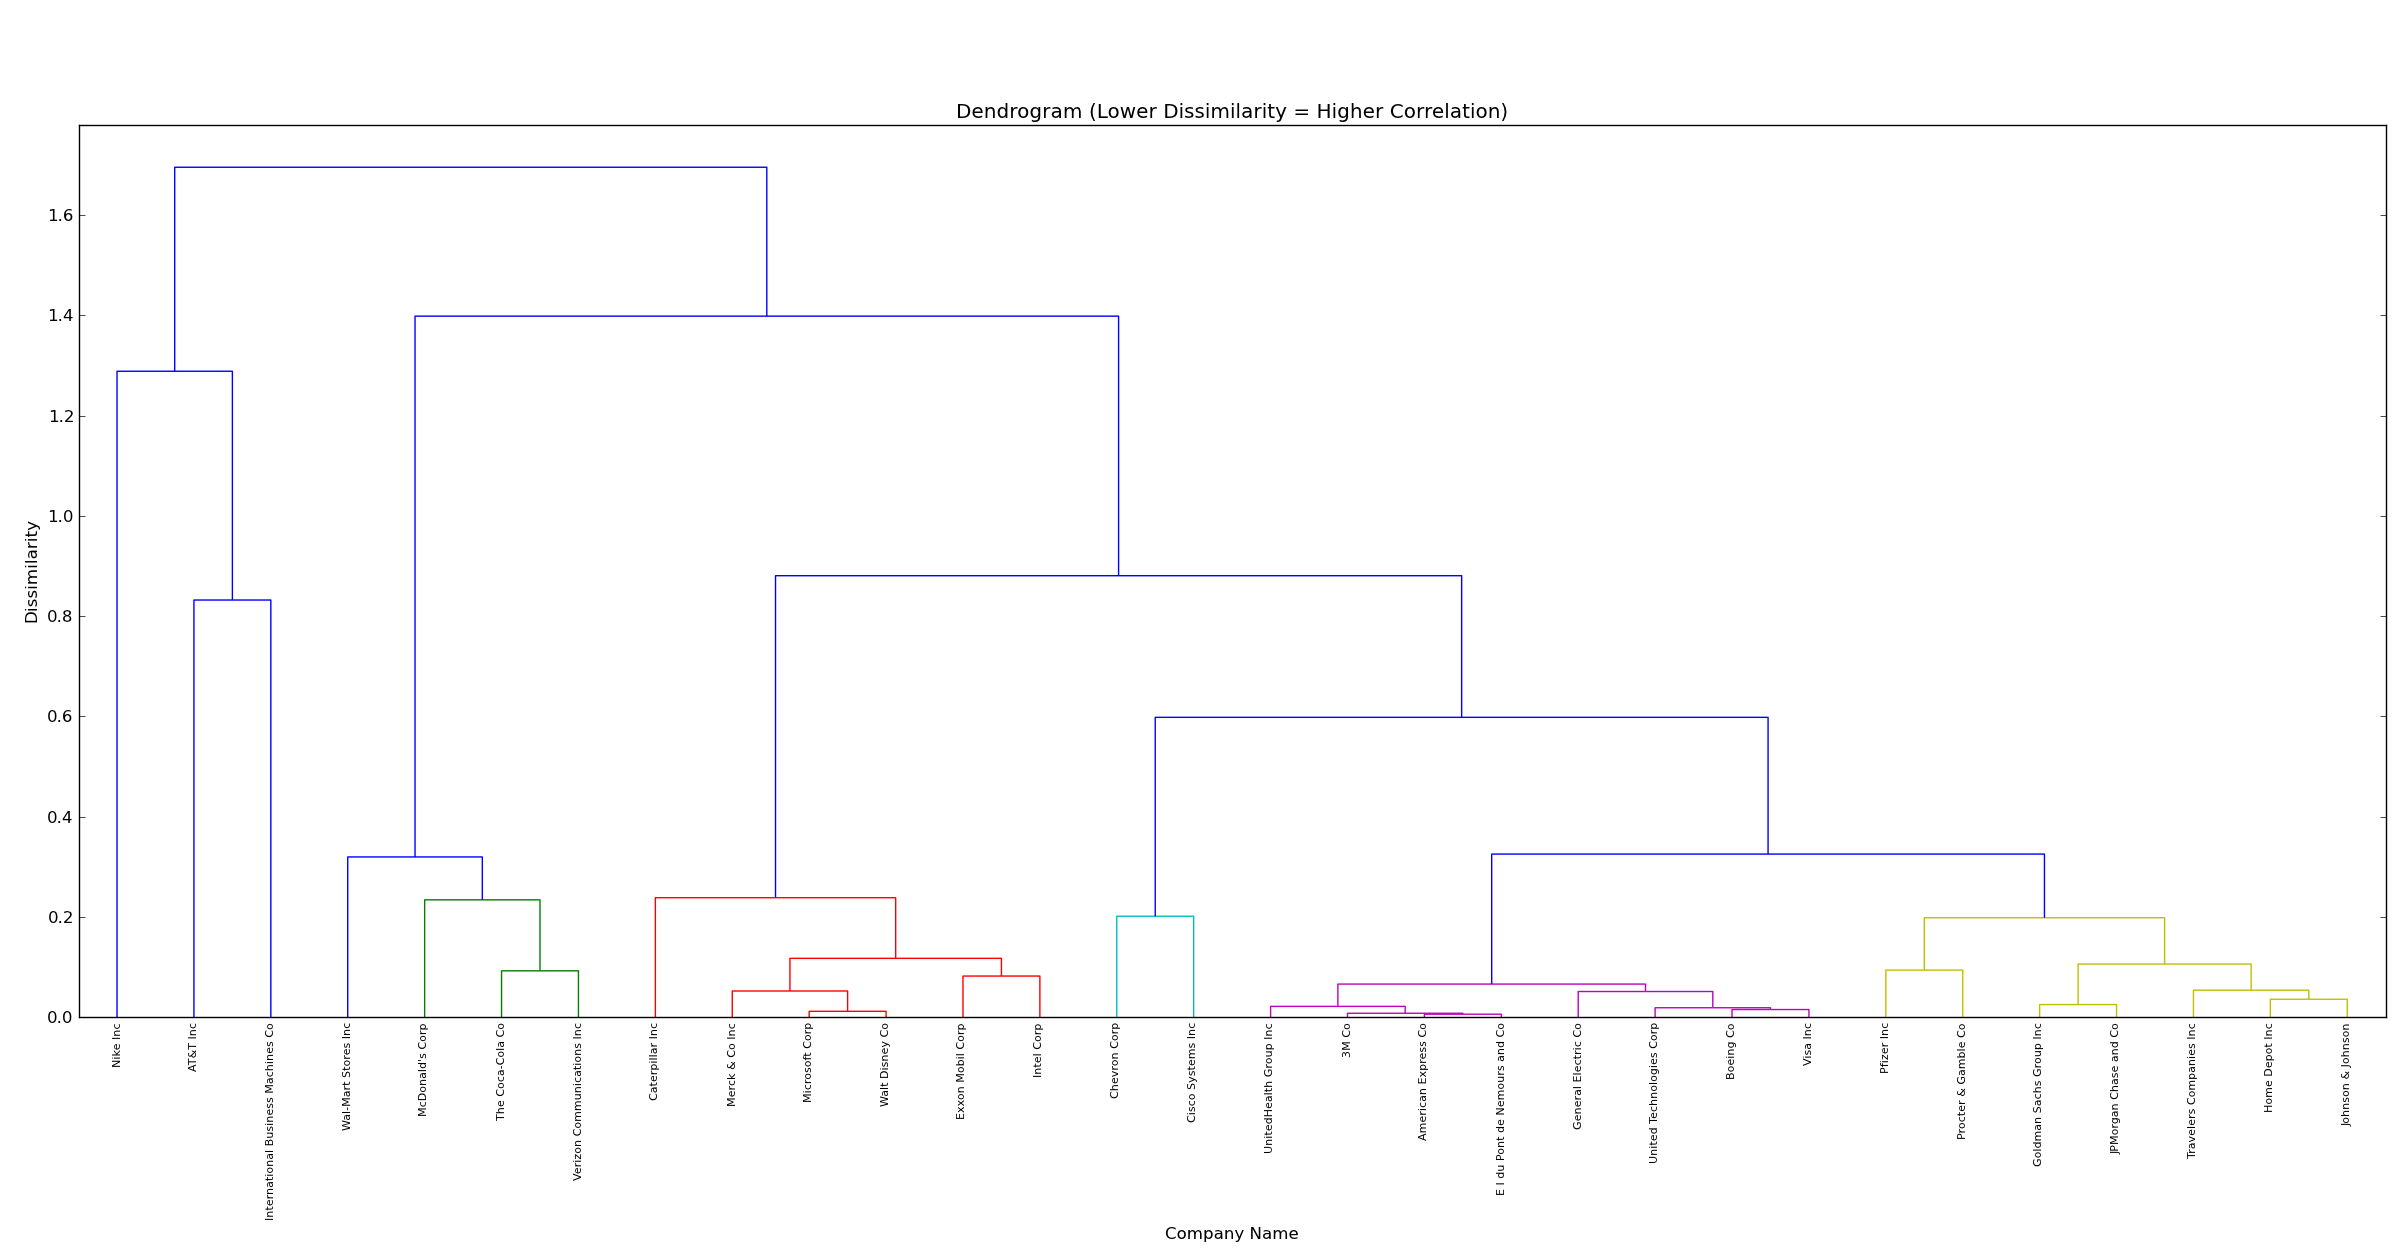
Stocks symbols are grouped into clusters based on a dissimilarity matrix constructed from computing Pearson's r. A dendrogram is produced. Additionally, clusters are color coded for easier identification.
Challenge URL:
https://www.mindsumo.com/contests/263
Running
python correlation_clustering.py
Usage
Guaranteed for Python 2.7.*. Recently tested to work on Windows x64, Python 2.7.13 x86-64, and latest matplotlib/scipy/numpy.
Resolve dependencies. Then, launch using command in "Running" section.
Follow prompts to choose an attribute on which to compute a dissimilarity matrix (computed from Pearon's r).
You may also opt to load your own CSV files (with defined headers) into the 2YearStockData directory.
Dependencies (Python Libraries)
matplotlib
scipy
numpy
Notes
A program like this is useful for preliminary idea generation for strategies like stat-arb as well as seeking diversification when constructing a portfolio.