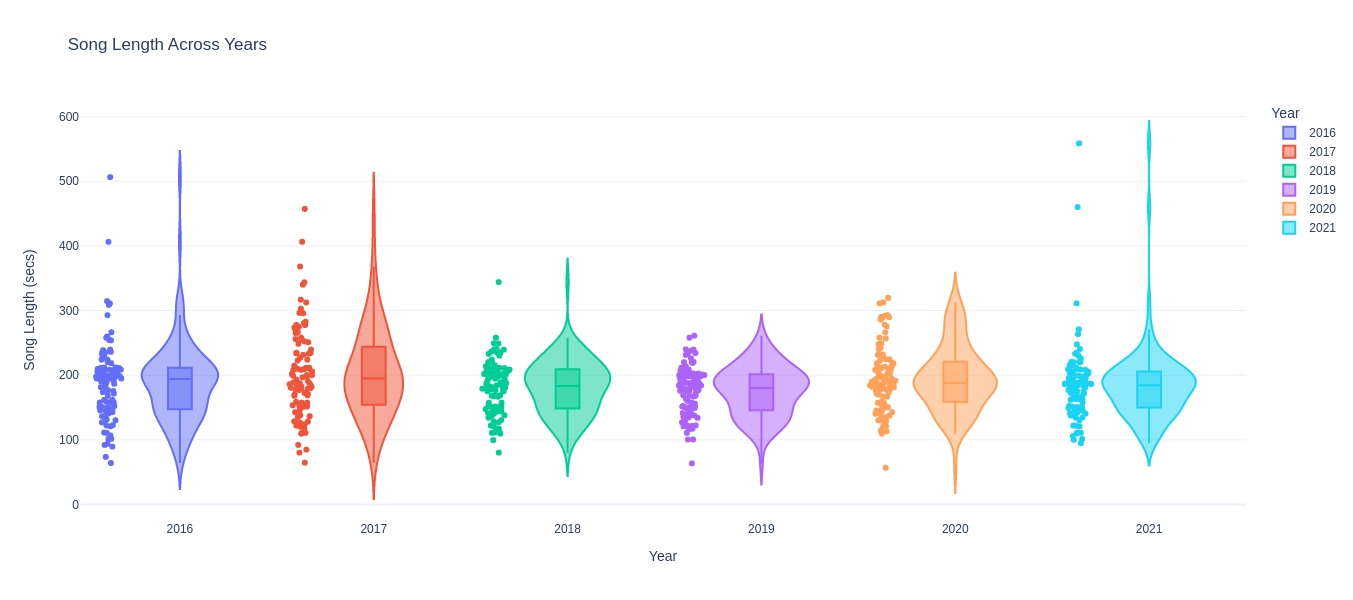
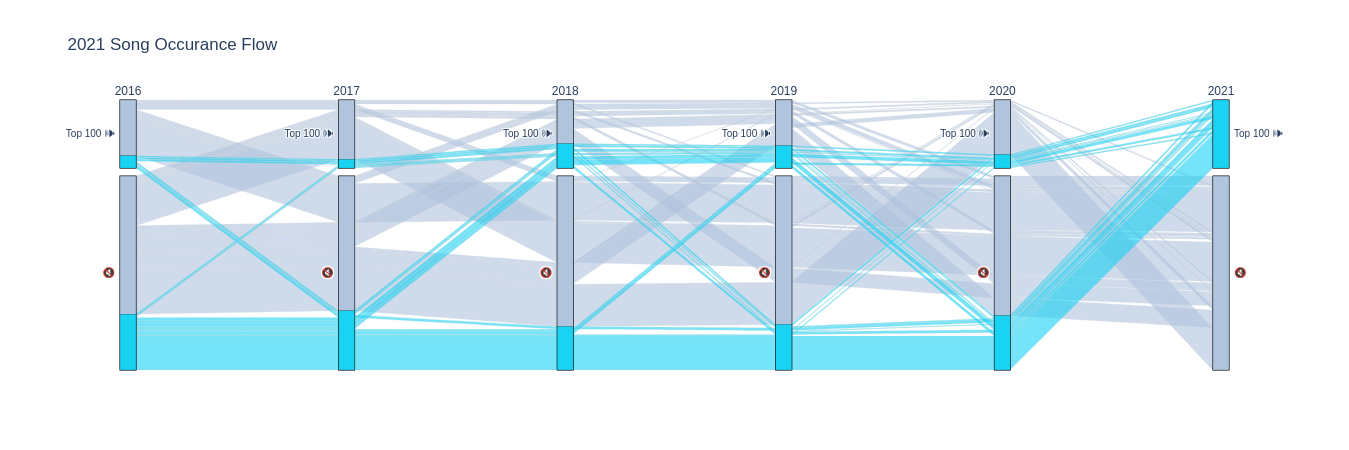
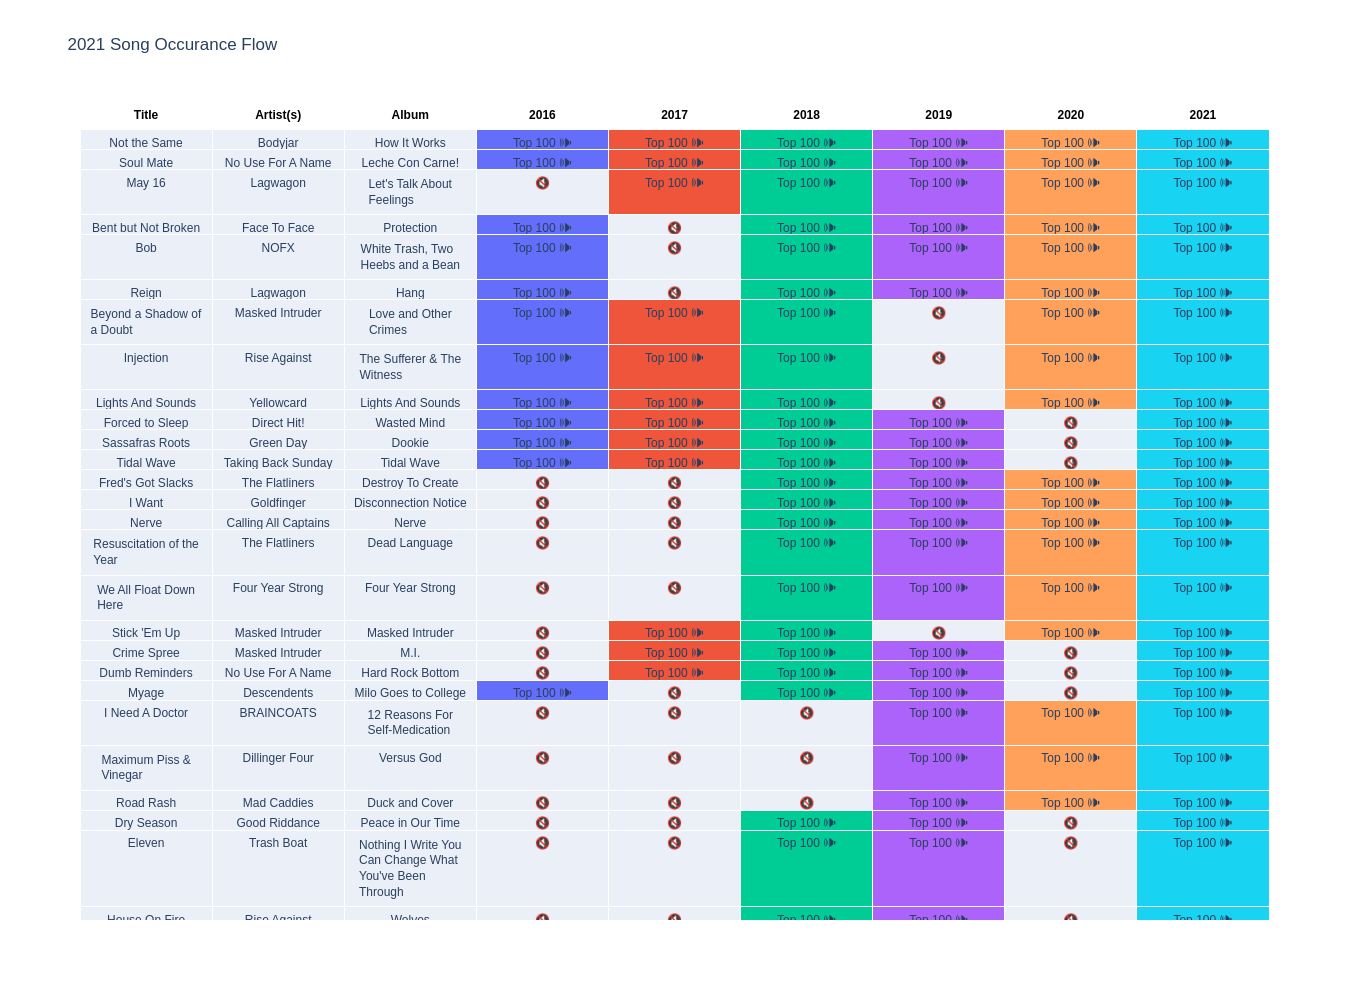
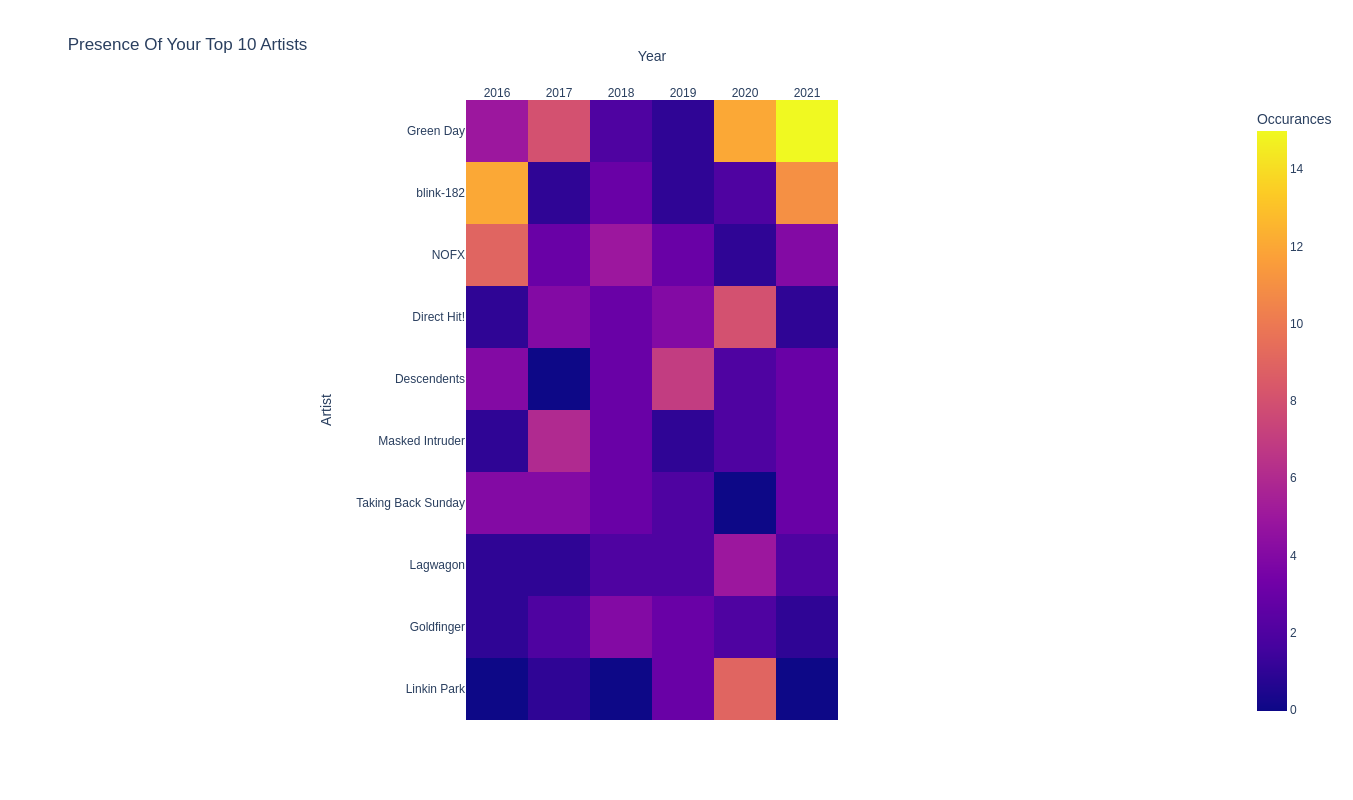
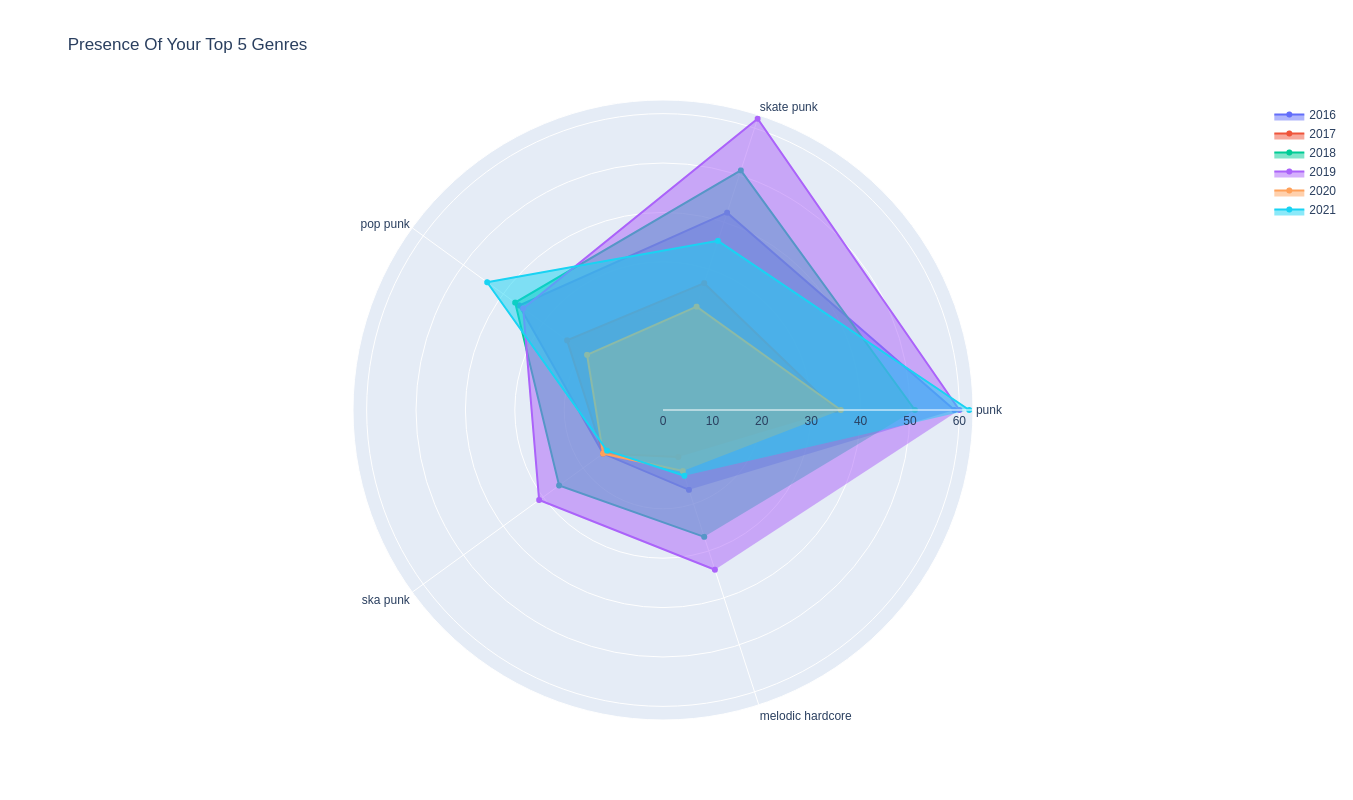
Interactive plot.ly graphs to compare your annual "Your Top 100 Songs" playlists
Due to Spotify's restrictive API, you need to jump through a lot of hoops to view your own details in this dashboard. The easiest way is to follow the instructions on the notebook locally or via Binder.
