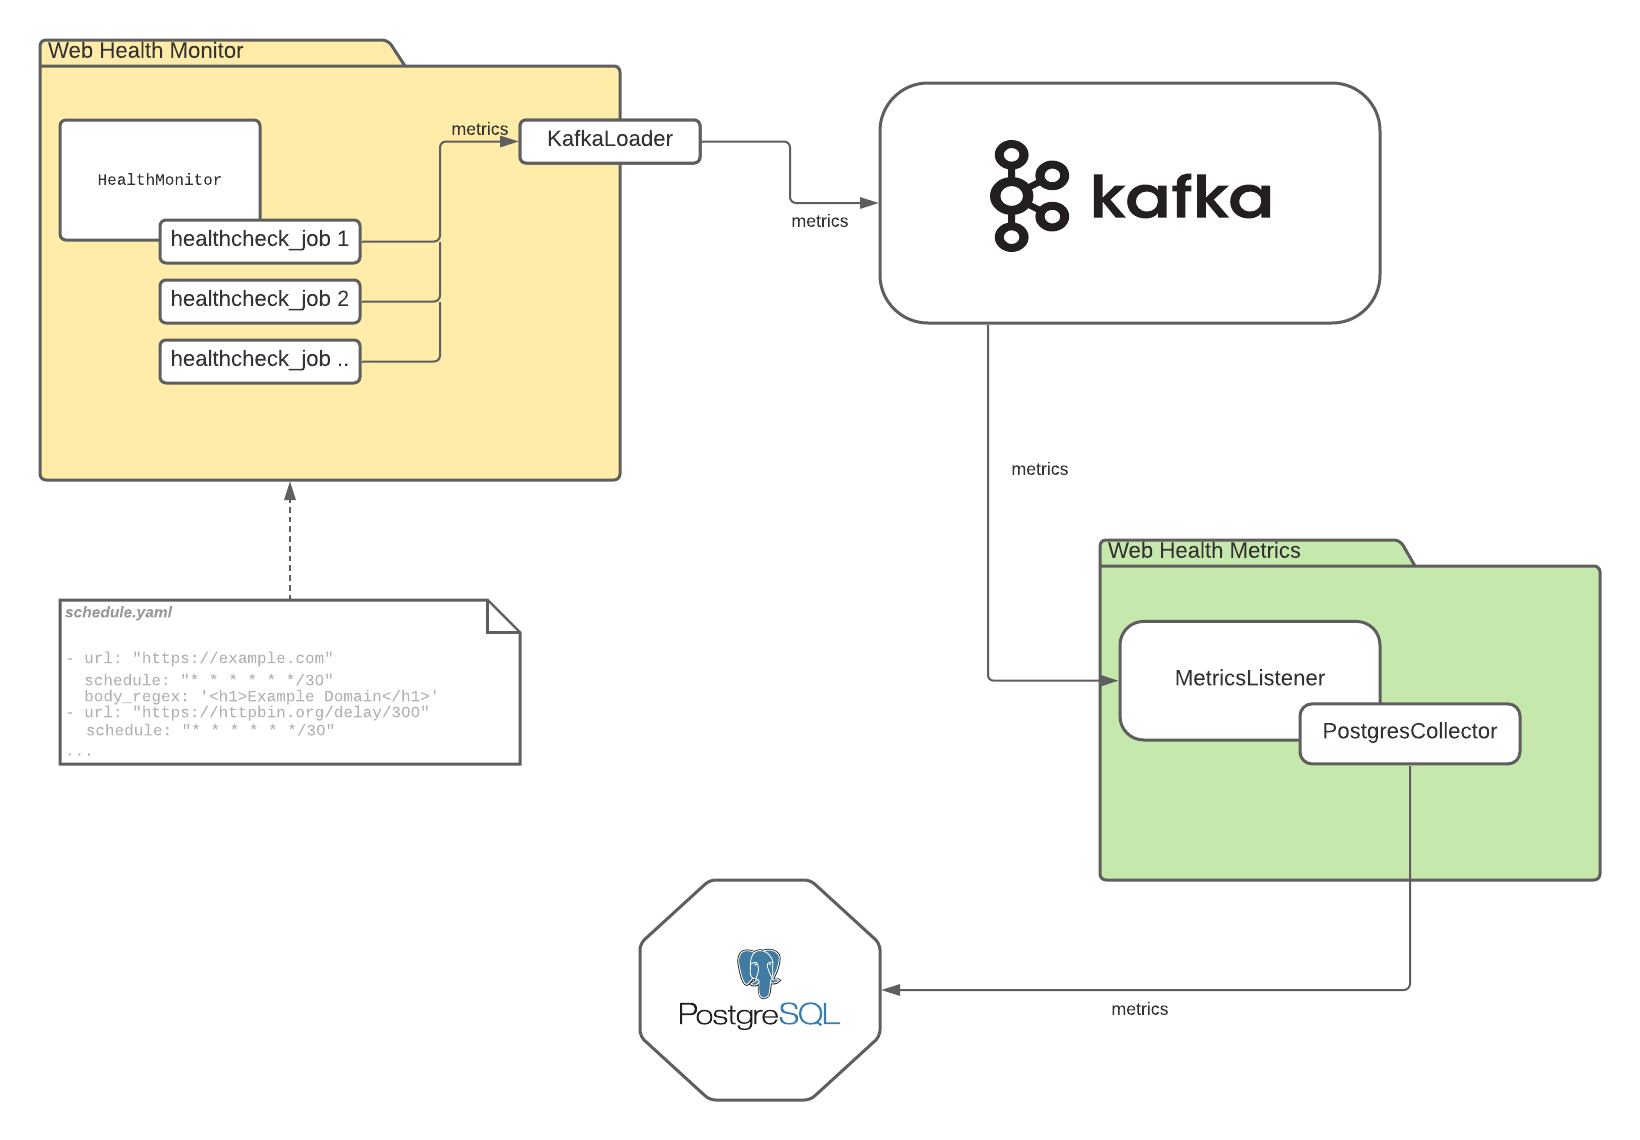
This tool intended to be used as a health monitor for a various web resources to monitor their health.
There is a two services, which operate separately and have different functions:
-
Monitor - monitor, which periodically checks list of web resources, collect health metrics and send them to loaders, which could load them in different locations (Kafka, Postgres, csv file, etc.). You could easily create your own loader base on
monitor.loaders.base.AbstractLoaderclass and connect it on application startup (seemonitor/run.py) -
Metrics - daemon, which listen to metrics in the Kafka topic, collect them and saves to PostgreSQL instance, or any other place defined in one of collectors
Each service has an .env file inside. You should fill it before build and run containers. If you want to connect your services
to some cloud providers, like Aiven Kafka and Aiven PostgreSQL, you should enable SSL connections in the .env and place
certificates in the corresponding directories inside init folder in each service's folder.
/monitor
    /init
        /kafka
            ca.pem - CA certificate
            service.cert - service certificate
            service.key - service private key
/metrics
    /init
        /kafka
            ca.pem - CA certificate
            service.cert - service certificate
            service.key - service private key
        /postgres
            ca.pem - CA certificate
All job entries are placed in the monitor/schedule.yaml. Structure of each entry:
url - target url to check
schedule - cron like schedule. The format is the same as in regular cron jobs, except you have ability to specify
period in seconds on the six place (like with * * * * * */30 schedule job will be run in every 30 seconds)
body_regex - optional field with regular expression to examine response's body
After that you could just run
docker-compose up -d
Enjoy!
List of all available environment variables (example already filled in monitor/.env and metrics.env)
Monitor
WH_KAFKA_BOOTSTRAP_SERVERS: comma-separated list of bootstrap servers. Example: localhost:9092
WH_KAFKA_OUTPUT_TOPIC: name of the target topic to upload metrics
WH_DEBUG: debug mode, default: false
WH_KAFKA_SSL_AUTH: enable SSL auth for Kafka. If this is set to true - you should place all required files for SSL context
inside monitor/init folder
Metrics
WM_METRICS_TOPICS: list of comma-separated topics to listen for new metrics
WM_DEBUG: debug mode, default: false
WM_BOOTSTRAP_SERVERS: comma-separated list of bootstrap servers. Example: localhost:9092
WM_POSTGRES_DSN: full specified DSN for postgres connection. Example: "postgres://postgres:postgres@localhost:5432/wm_metrics" NOTE: Database listed in DSN should be created manually before you run application
WM_KAFKA_SSL_AUTH: enable SSL auth for Kafka. If this is set to true - you should place all required files for SSL context
inside metrics/init folder
WM_POSTGRES_SSL: enable SSL auth for Postgres. If this is set to true - you should place all required files for SSL context
inside metrics/init folder
For local development you could connect seconds yml file for docker-compose, which contains local services for Kafka, Zookeeper and PostgreSQL. Change your env files to disable ssl connection for Kafka and Postgres. Inside Docker network
Kafka will be available on port 29092 and outside localhost:9092 will be open. Postgres port is default with username:password - postgres:postgres
Command to start local development
docker-compose -f docker-compose.yml -f docker-compose.dev.yml up -d
