- cryptolord
The motivation behind this project is to help educate consumers on precise times to buy and sell crypto shares. In a booming world of blockchain technology, everyone wants to get their hands on the next crypto to explode onto the markets. Our goal is to gather all of the up to the second crypto information that will help our readers make the best decisions going forward whether it be to buy, sell, or hold on to their coins. What we hope to convey is proper trustworthy information using machine learning and data analysis, in a world full of self proclaimed crypto experts.
Our group is currently in active communication via Slack, Discord, Zoom, Google Docs and Git.
This project currently has several working scripts. First, MongooseAxios.js has a function getData(coinid, currency) that first checks our mongoDB instance for data relating to the requested coin and in the requested currency and if it finds the data, returns it. If it does not find the data, MongooseAxios will then send a GET request to CoinGecko API and store the response in the mongoDB and return it to the user.
The second script is dataExploration.ipynb which is a JuypterNotebook file that pulls sample testing data from the mongoDB instance, performs some preprocessing and implements a neural network model. This work is mostly a proof of concept since the current data schema in the database has changed and we still need to implement "Data Windowing" which is splicing the data into "window" sections that will be used for final training and testing.
This CoinGecko data is cryptocurrency price vs time data of the shape {data: {[prices], [market_caps], [total_volumes]}}. Starting in dataExploration5 we have moved on to the CryptoCompare API which has minutely OHLC (open high low close) data for cryptocurrencies. We have thus far pulled data for bitcoin, solana and ethereum.
This project first, via MongooseAxios2.js pulls the week's minutely data from CryptoCompare API and caches it in MongoDB. Then in dataExploration7.ipynb we pull the data from MongoDB and associate relevant technical trading indicators to it. These include volume, RSI, ADX, MACD, moving averages and Bollinger Bands from different time frames. From here we compute a new indicator, we call buy_sell_hold which is the normalized distance to the nearest local extrema with a 1 indicating that the close is at a minimum and thus a "buy" and a -1 indicating the close price is at a maximum and so indicating a sell.
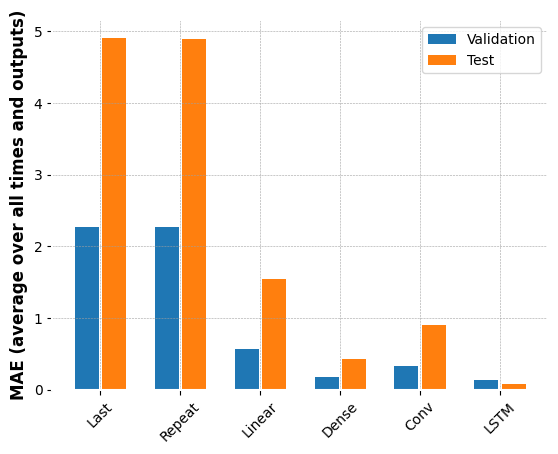
Then, separate the data from its buy_sell_hold label and perform window generation to chunk the data into windows of specified time frames. For our exploration, these were 6 minute windows predicting one minute and 30 minute large windows predicting the next 30 minutes. We follow the TensorFlow Time Series machine learning tutorial for this section and likewise apply several different machine learning models to determine the optimal one. For a smaller dataset, it appeared that our dense model was best, but with a week passing, we were able to acquire more minutely data and the extra data appears to have given the LSTM (Long Short-term Memory) model the edge. Thus for our predictions going forwards we will use the trained LSTM model.
Finally we have a visualization file that that renders our data as well as our predictions.
The image below shows the comparison of the different machine learning models with shorter windows being used for data sampling. The LSTM model is the best performing model.
The image below makes a comparison between the different machine learning models with longer windows being used for data sampling. The LSTM model is the best performing model.
The combined image that follows, showcases the Average True Range (ATR) and the Moving Average Convergence Divergence (MACD) of the Bitcoin data. It also show cases the ballbinger bands in the first graph. The second graph shows the MACD and the MACD Signal. The third graph shows the RSI and the ADX, while the final graph shows the volume.
This image that follows, shows the relative extrema of the Bitcoin data. The red line is the minimum and the blue line is the maximum.
The following image shows the code used to generate the windows.
Finally, the images below show the sample outputs of our predictions during the machine learning process (testing and training the models).
Moving forwards with this work, we would like to clean our workflows and render estimations of profit and loss based on buys and sells recommended by the model. Further we would like to fine-tune our model based on different time-frames, metrics and indicators and generally perform a sweep of the number of neurons and epochs. We will also be taking this as an opportunity to port the Mmachine Learning code written in Python into Javascript so as to build a web-based application project. Tensorflow offers a library in Javascript which works in a similar fashion to Pandas, its called Danfo. The majority of Tensorflow machine learning is based off Java.
Furthermore, we would like to work towards De-Normalizing the data, as the idea of creating specific ranges for a currency which truly varies immensely must be taken into account for furthering the accuracy of our predictions. This also provides us with an additional opportunity to work with the outliers in our data which could possibly be throwing our predictions off, hence furthering our goal.


