The system was improved during 2023 season and the latest code is under revision to be published ASAP
More information can be found in
* "Development of a consumer-grade scanning platform for fruit thermal and position data collection" [paper - presentation]
* "A Low-cost RGB-D/thermal platform for monitoring fruit temperature with spatial resolution [ IN PRESS - Conference Proceedings of the II International Symposium on Precision Management of Orchards and Vineyards. PMOV2024. 3-8 Dec 2023. Tatura, VIC, AUS - presentation]
The project SHEET (Sunburn and heat prediction in canopies for evolving a warning tech solution) is part of the ERA-NET co-funded ICT-AGRI-FOOD, with funding provided by national sources (Italian Ministry of the University and Research) and co-funding by the European Union’s Horizon 2020 research and innovation program, Grant Agreement number 862665. https://ictagrifood.eu/node/44656
To better understand the following code and its purpose, it is strongly suggested to download and have a read at "D2.2-SHEET_RGB-D-Thermal system.pdf", since this repository contains the code described in the aforementioned D2.2 deliverable "Fruit (Apple and grape cluster) Thermal and Positional data extraction by means of RGB-D/Thermal cameras, neural networks and computer vision"
To clone the "sheet_prj" conda environment needed to run the code, download 'environment.yml' within the "conda_env" folder. After it, surf to the downloaded folder containing the '.yml' file and run the following command:
conda env create --file environment.yml
After it, activate the required environment
conda activate sheet_prj
The whole code is contained inside the SHEET_RGBDT_system folder of the current repository.
-
Get_alignment_factors.py- run this script when performing the RGBD (Intel Realsense D435) and thermal image (SEEK Compact Pro) alignment to get the .txt files to be supplied insideINPUTS.py. Examples of images to be supplied to this script are contained inside "SHEET_RGBDT_system/" within the "colore" (= color) and "termico" (= thermal) folders. -
INPUTS.py- compile this script with the required information and directories. It is important to include "_img_" in the RGB filenames and "_thermal_" in the filenames of raw thermal images.
SPECIE- define the fruit tree under analysis ('apple' or 'grape').
IMAGE_CARDINAL_FACE- define the tree side shot in the pictures - East (e), Weast (w), North (n), South (s).
TRUNK_DIST- shooting distance in metres (m) between RGBD/T cameras and trees.
ALIGNMENT_COORDS- path to thealignment_coords_SHEET_deliverable.txtfile produced byGet_alignment_factors.py. The file is used for RGB-D/T images alignment, and it can be found at the following project directory:SHEET_RGBD-T_system_v_2022 > SHEET_RGBDT_system > colore
IMAGE_FORMAT- input images file format (.png, .jpg) - better to use .png.
RGB_PATH- path to the folder storing the RGB images taken from the field with proper filenames.fuji_2022-08-04-09-44-15_img_31.png
DEPTH_PATH- path to the folder storing the depth images taken from the field.fuji_2022-08-04-09-44-15_depth_31.png
RAW_THERM_PATH- path to the folder storing the ROS - generated thermal images taken from the field.fuji_2022-08-04-09-44-15_thermal_31.png
FRUIT_DETECT_YOLO_LABELS_PATH- path to the folder storing the YOLO .txt labels produced with the fruit detection.
TRUNK_DETECT_YOLO_LABELS_PATH- path to the folder storing the YOLO .txt labels produced with the trunk detection.
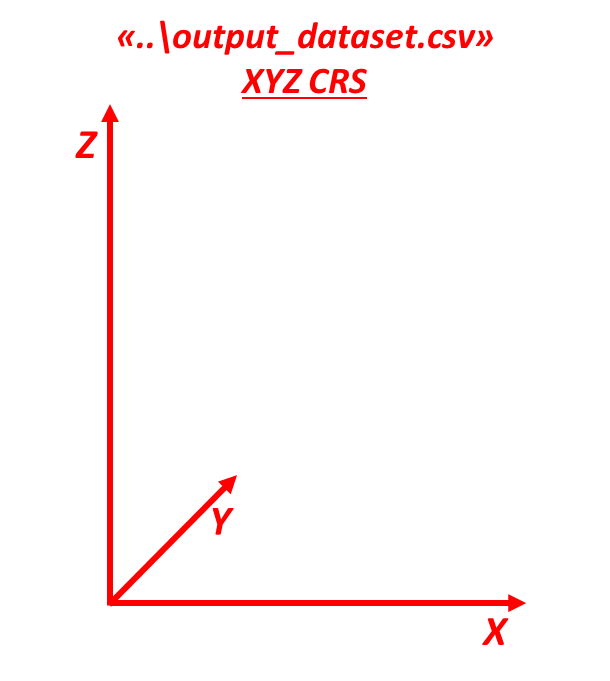
OUTPUT_DF_PATH- define path and filename of the.csvfile where to store the primary output file - i.e., the file with XYZ coordinates system useful for data visualisation.directory = "..\output_dataset.csv"
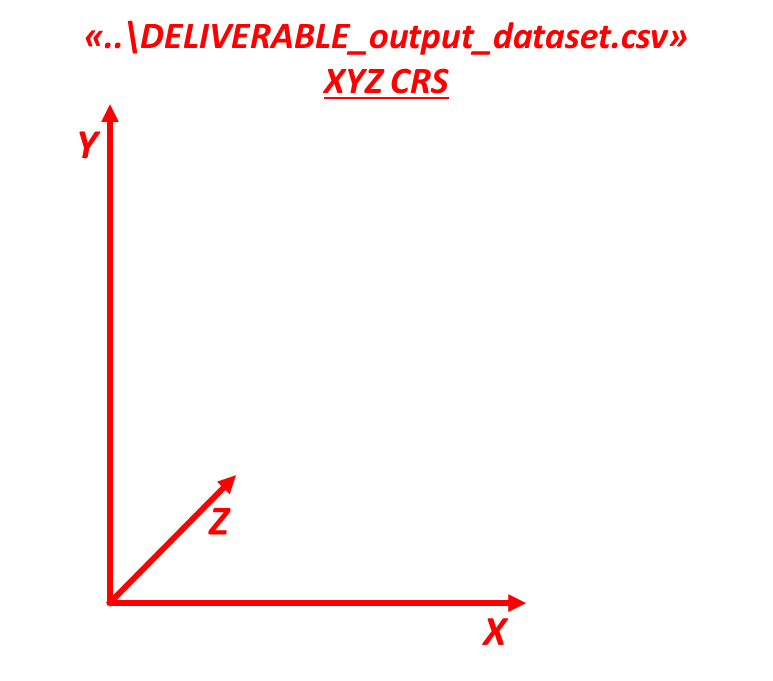
DELIVERABLE_OUTPUT_DF_PATH- define path and filename of the.csvfile where to store the secondary output file - i.e., the file with XYZ coordinates system useful for data interpretation.directory = "..\DELIVERABLE_output_dataset.csv"
TH_CALIBRATION- path to the .txt file containing data about distance effect on temperature estimation. These data must be directly obtained from channel 2 and 3 of the .Tiff files produced with the SEEK Compact pro mobile APP. The .txt file must be organised as showed in the following Table, with separator = " ".
| dist | Raw min | Raw max | Raw avg | C min | C max | C avg | IFOV_mm |
|---|---|---|---|---|---|---|---|
| 0.5 | 2132 | 6662 | 3723.86 | 0.78 | 56.81 | 23.16 | 2.62 |
| 1.0 | 2168 | 6498 | 3733.16 | 1.20 | 54.98 | 23.25 | 5.23 |
| 1.5 | 2188 | 6354 | 3752.02 | 1.56 | 53.37 | 23.56 | 7.85 |
| 2.0 | 2208 | 6264 | 3750.72 | 2.16 | 52.34 | 23.58 | 10.47 |
| 2.5 | 2252 | 6146 | 3761.66 | 3.03 | 51.06 | 23.74 | 13.08 |
| 3.0 | 2278 | 6016 | 3752.88 | 3.74 | 49.71 | 23.76 | 15.70 |
- dist = distance obj - camera in metres (m)
- Raw min = bbox minimum thermal raw value
- Raw max = bbox maximum thermal raw value
- Raw avg = bbox average thermal raw value
- C min = bbox minimum Celsius value
- C max = bbox maximum Celsius value
- C avg = bbox average Celsius value
- IFOV_mm = camera Istantaneous Field of View (millimetres) at the given distance, and calculated on a 3x3 pixels matrix.
Since in future versions of the code, the INPUTS.py script will be improved, it is strongly suggested to organise all
the primary data into a unique directory as showed in the following image.
RUN_file.py- run this python file to make the program work. It runs a workflow of the following processes:
- RGBD/T alignment, performed by the
ALIGNMENT.pyscript.- Fruit temperatures and XYZ positions extraction, performed by the
SHEET_Temp_Position_extractor_from_Yolo.pyscript.- 3D visualisation of the primary data stored within the
output_dataset.csv. The scriptVisualise_orchard.pywill produce three plots:
- whole extracted data plotted together
- single tree plot with relative coordinates ranging from 0 to 1
- single tree plot with relative coordinates in millimetres.
Currently, it is needed to specify within the Visualise_orchard.py script, the image filename from which plotting fruit temperatures in the 3D space.
grape_image_fn_to_filter_data_for = '2022-08-03-12-06-54_img_0001'
apple_image_fn_to_filter_data_for = 'gala_2022-08-04-10-43-57_img_01'
- Dataset conversion from primary to secondary dataset, performed by the
reordering_output_CSV_for_DELIVERABLE.pyscript.
The RUN_file.py script it is composed of few lines of code, which manage the required workflow.
# RGBD-T alignment
start = time.time()
exec(open('ALIGNMENT.py').read())

# temperature and position extraction of each detected object and output dataframe creation
exec(open('SHEET_Temp_Position_extractor_from_Yolo.py').read())
end = time.time()

# visualisation
exec(open('Visualise_orchard.py').read())

# modify the dataset to change XYZ axis
exec(open('reordering_output_CSV_for_DELIVERABLE.py').read())
print(f'\nminutes {(end - start)/60}')
Thanks to this execution architecture, it is possible to activate or deactivated specific processes by commenting their executive line.
For example, the following RUN_file.py is commented in order to only show previously obtained data.
# RGBD-T alignment
start = time.time()
# exec(open('ALIGNMENT.py').read())

# temperature and position extraction of each detected object and output dataframe creation
# exec(open('SHEET_Temp_Position_extractor_from_Yolo.py').read())
end = time.time()

# visualisation
exec(open('Visualise_orchard.py').read())

# modify the dataset to change XYZ axis
# exec(open('reordering_output_CSV_for_DELIVERABLE.py').read())
print(f'\nminutes {(end - start)/60}')
The main code authors are Mirko Piani and Gianmarco Bortolotti from the fruit trees department (DISTAL) of the University of Bologna (IT). Reach out our group ECOPOM on LinkedIn 🚀
Special thanks to all the other authors and contributors: Dario Mengoli, Nicolò Omodei, Simone Rossi Luigi Manfrini
- See the full deliverable including results on LiDAR based system and manual thermal data collection: (File 'FULL_version_D2.1+2.2+2.3+2.4_ATB_Unibo.pdf' here in the repo)
- Full paper on Lidar-Thermal Alignement: https://www.methods-x.com/article/S2215-0161(22)00093-0/fulltext


