This is a work in progress. The purpose of this project is to build an infrastructure automation use case around the collection and presentation of storage metrics. The approach being taken is to use:
- collectd whenever possible (using exec) and other custom scripts as necessary to gather metrics
- InfluxDB to store the metrics as time series data
- Grafana to visualize the metrics
The deployment of these supporting apps and code will be containerized and completely software defined.
clone this repository, set up your array IPs & credentials in the respective yml files and then run:
$ docker-compose up
Grafana runs in a single container and a dashboard is set up for each storage array, with a corresponding datasource. InfluxDB and collectd are deployed together in pairs of containers, one pair for each storage array.
docker-compose will pull images from docker hub:
- https://hub.docker.com/_/influxdb/: used directly
- https://hub.docker.com/r/grafana/grafana/: Dockerfile adds HTTPie
- https://hub.docker.com/_/alpine/: Dockerfile installs collectd and associated collector code for the specific array type
For ECS-collectd:
- Put your ECS IP address, user ID and password into
ecs-creds.yml(from provided template) collectd.confis generic except for:- The Plugin network section sets up collectd to send data to 127.0.0.1 and port 25826
- The Plugin exec section that calls
collect-ecs.js.
For ECS-influxdb:
influxdb.confis the generic conf file, the only change is to enable collectd with'enabled=true'- Admin access is configured via
bind-address = ":8083" - The HTTP API endpoint port is place you go to query InfluxDB for data, and is configured via
bind-address = ":8086" - It is listening for collectd metrics on UDP port 25826 via
bind-address = ":25826"
- Admin access is configured via
For SCALEIO-collectd:
- For now this just contains a copy of the collector setup for ECS (and points to the same ECS array as above). This is just a placeholder for setting up a true ScaleIO collector. To show that the data is unique for this dashboard, the metrics are artificially inflated by 10x.
For SCALEIO-influxdb:
influxdb.confcontains the following modifications from the generic conf file:- Enables collectd with
'enabled=true' - Admin access is configured via
bind-address = ":8084" - The HTTP API endpoint port is place you go to query InfluxDB for data, and is configured via
bind-address = ":8087" - It is listening for collectd metrics on UDP port 25827 via
bind-address = ":25827"
- Enables collectd with
For Grafana:
dashboards/ECS.jsonis functional, credit Jonas Roslanddashboards/SCALEIO.jsonis waiting for a datasource. When the collector is written, this dashboard JSON definition will be used to display the metrics. Credit swisscom- Other dashboards are placeholders
setup.shautomates the setup of any defined Grafana datasources and dashboards
Other Notes:
types.dbdefines how collectd metrics are structured and InfluxDB needs it in order to store them. No customization needed.
After running docker-compose, you can access:
- The InfluxDB web admin page for ECS and ScaleIO at http://localhost:8083 & 8084 respectively
- Grafana at http://localhost:3000 (login with default admin/admin, and the dashboards will be all set up)
Current status 1/17/18: the ECS dashboard is up and running, the ScaleIO dashboard is available as a placeholder showing unique data, and the other dashboards are TBD.
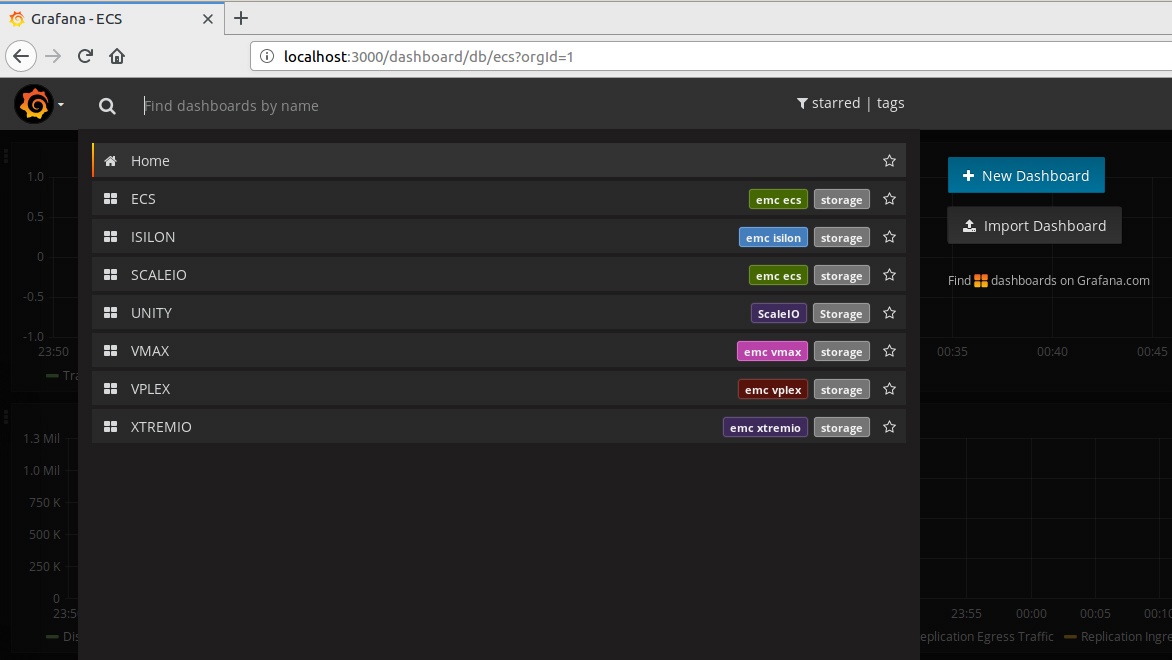
The list of available dashboard will look similar to this:

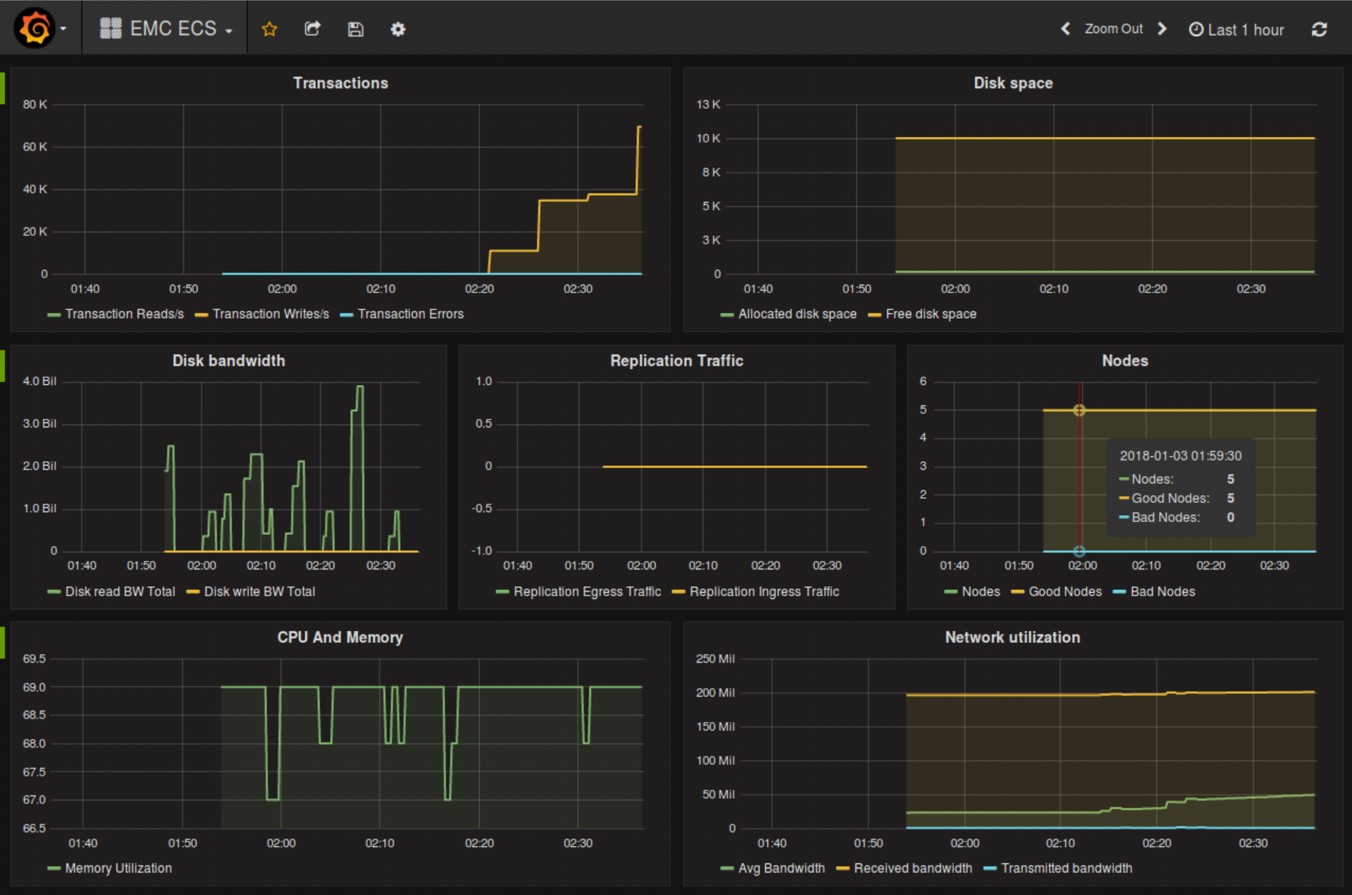
The ECS dashboard looks like this:

The util directory contains some shell scripts that may be useful in dev:
- dockerNuke.sh: blows away all containers and images - use with care
- putFileToECS.sh: uses s3curl to put a file into a test bucket (generate workload for ECS)
- setECStoken.sh: curl command to set the ECS token for later use, stored as cookiefile
- getECSinfo.sh: curl command to get ECS config info, must first have cookiefile from above
- setupGrafana.sh: Grafana API calls via HTTPie commands to set the Grafana data source and dashboard framework, credit Jonas Rosland
https://blog.laputa.io/try-influxdb-and-grafana-by-docker-6b4d50c6a446: setup of collectd, InfluxDB and Grafana https://github.com/jonasrosland/collectd-ecs: prior work getting metrics out of ECS using python https://www.emc.com/techpubs/ecs/ecs_api_object_control_service-1.htm: Using the ECS management REST API https://oldhenhut.com/2016/09/01/examples-of-ecs-api-usage: ECS API usage via s3curl
ECS: code in this repo currently collects, stores and displays 24 metrics
ScaleIO: work has already been done for collectd integration at https://github.com/swisscom/collectd-scaleio
Isilon: via Insights connector - https://github.com/Isilon/isilon_data_insights_connector
VPLEX: maybe also a lead on how to proceed via https://community.emc.com/thread/239953?start=0&tstart=0
VMAX: looking to leverage work by Vijay Kumar & Craig Smith - https://github.com/VijayEMC/VMAX_UnisphereAPI
VNX/Unity: Integrate work done by Craig Smith at https://github.com/EMC-Underground/vnx-info-collector
XtremIO: reference https://kodywilson.com/2016/11/07/infrastructure-metrics-with-grafana-and-influxdb/