SolarWinds SWIS DataSource based on Simple JSON Datasource
SWIS (SolarWinds Information Service) uses SWQL language - learn more
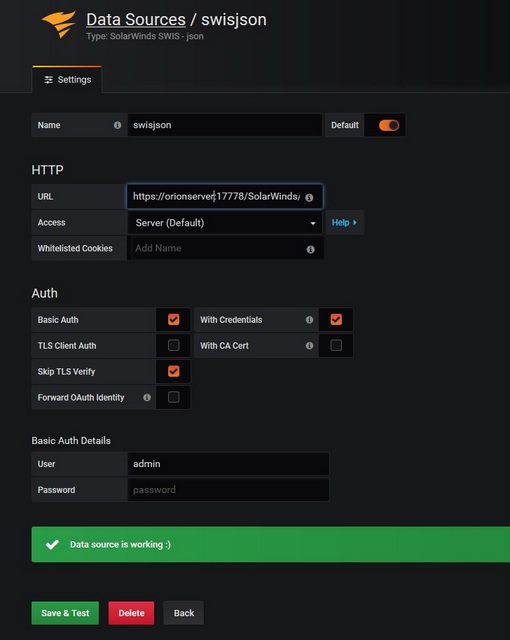
DataSource connects to SWIS HTTP REST endpoint. As URl specify SWIS HTTP endpoint address which is by default
Unfortunately this endpoint doesn't support CORS so we can connect only via Server(default) and due to self-signed certificate we need to check option 'Skip TLS Verify'. Anonymous connection is not permited so you need to fill in your orion account credentials.
SWIS query language
SWQL language is proprietal solarwinds query language to get data from all their data sources, learn more
Time Series:
For time series data there are these conditions.
- There has to be time column
- There has to be string column to define metric name
- There has to be value column(s), in case more columns are specified we will add suffix to metric name.
- Data must be ordered by time
Table:
- No restriction to data queries
Grafana macros available to use:
- $from - time interval start
- $to - time interval end
- $__interval - interval length for sampling
Time Sampling:
- For sampling you must use function downsample([timecolumn]). Sampling interval is used automaticaly from variable $__interval
Variable queries:
- you need to define __text (manadatory) and __value columns:
SELECT Caption as __text, NodeID as __value FROM Orion.NodesVariables are used in query via its name with prefix $.
SELECT .... FROM ... WHERE .... AND NodeID IN ($Node)For annotation queries:
- you need to specify datetime column (mandatory) and then you can set text and tags columns
  SELECT EventTime as time, Message as text, s.EventTypeProperties.Name as tags
  FROM Orion.Events s WHERE EventTime BETWEEN $from AND $to
Example of query with time sampling to display CPUload and memory per node:
SELECT
     downsample(ObservationTimeStamp) as time,
     a.Node.Caption,
     AVG(AvgLoad) as CpuLoad,
     AVG(AvgMemoryUsed) as MemoryUsed
FROM Orion.CPULoad a
WHERE ObservationTimeStamp BETWEEN $from AND $to
GROUP BY downsample(ObservationTimeStamp), a.Node.Caption, a.NodeID
ORDER BY time DESC
Installation Manually
- Download sources zip file.
- Extract the zip file into the data/plugins subdirectory for Grafana.
- Restart the Grafana server
- To make sure the plugin was installed, check the list of installed data sources.
