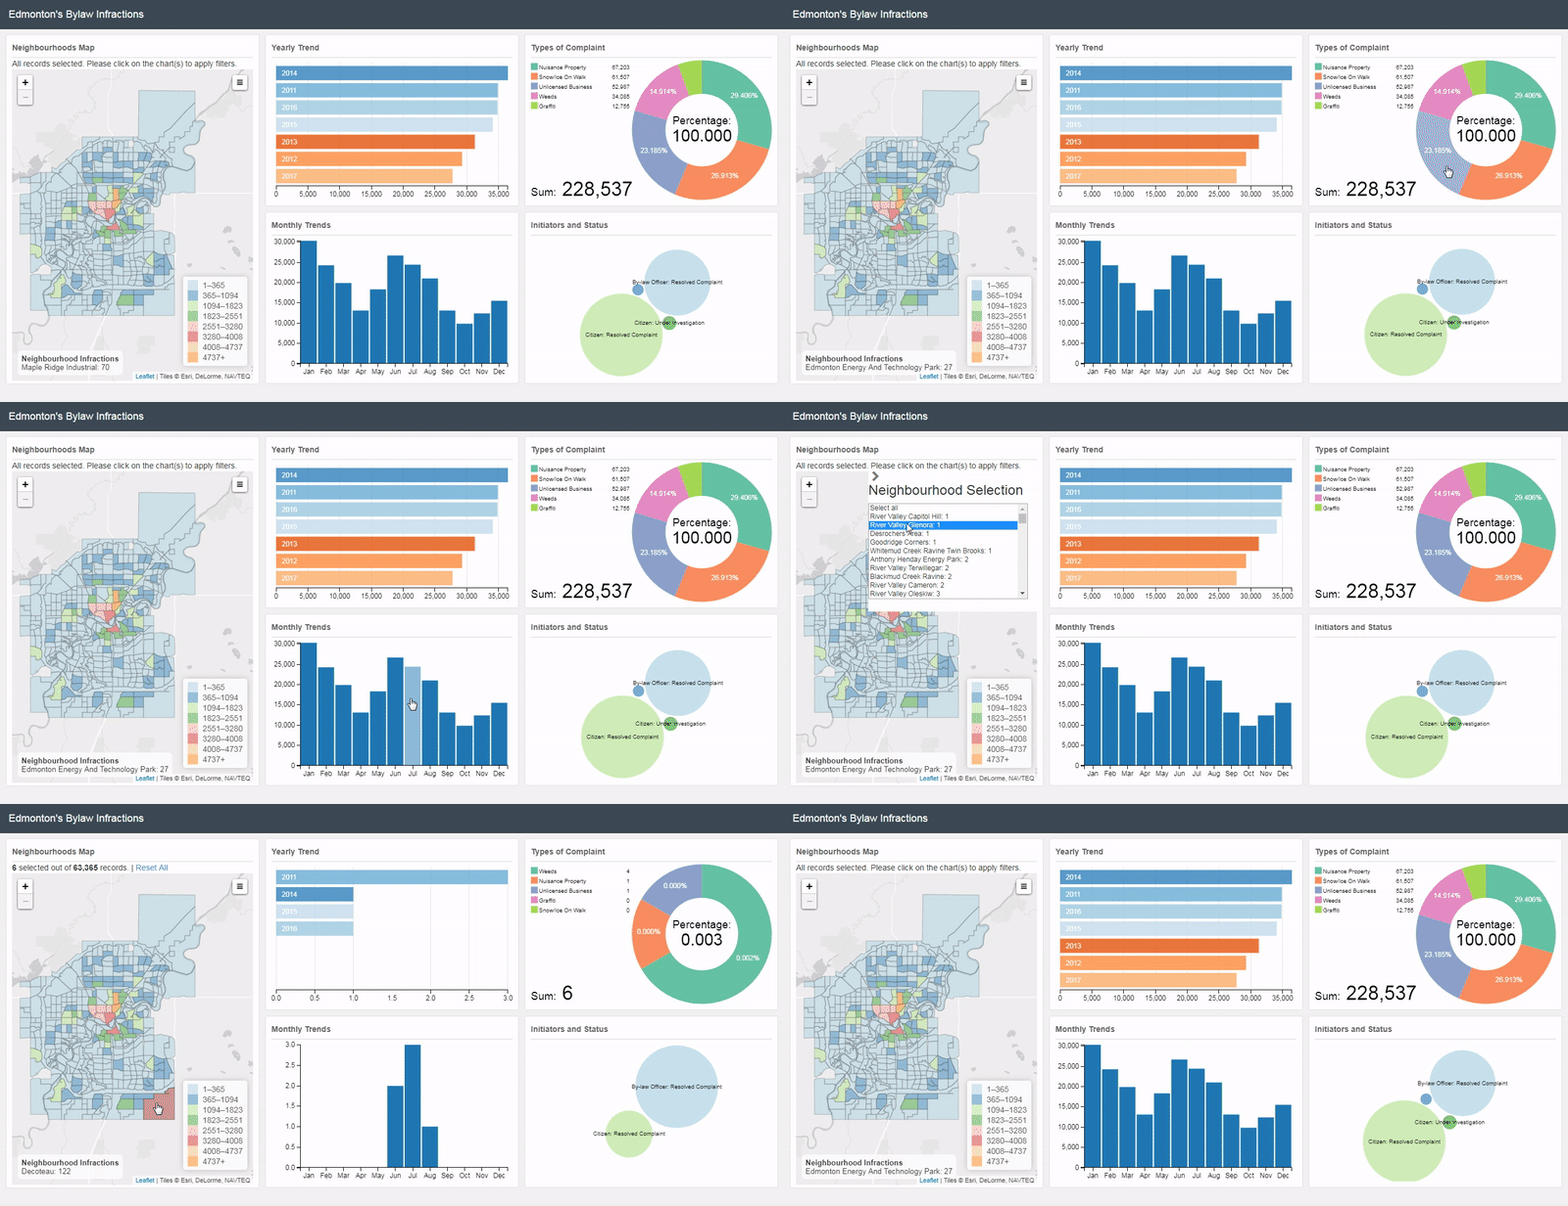
Larger map display, row and bar chart addition, and map encapsulating selection options are some improvements to Dashboard I. Data used in Dashboard II is similar to Dashboard I. Dashboard II's code is more efficient, maintainable, and scalable.
Inspiration for the Project: Mean Daily Temperature Extremes and drive to complete crucial To-do's
Frameworks used include: Leaflet.SlideMenu, FontAwesome, Spin.js and same frameworks as Dashboard I
Best viewed in: Google Chrome
Desktop and mobile Dashboard: BYLAW INFRACTIONS DASHBOARD II (CLICK ME!)
Note: FAILURES OF DASHBOARD I MADE DASHBOARD II A REALITY
| No. | Dashboard I | Dashboard II |
|---|---|---|
| 1 | Wrote code in the constraints of Le choropleth and Interactive Data Visualization | Learning responsive basics facilitated desired improvements |
| 2 | Not taking time to understand arising issues | Understood arising issues using global variables and Document Object Model |
| 3 | Intimidated by Mean Daily Temperature Extremes code and didn't extract needed code | Diving deeper into d3.js, dc.js, leaflet.js, dc-addons.js, and bootstrap docs aided in code efficiency |
| 4 | Abruptly used researched examples without deep thought | Mathematical procedures and operations are paramount for responsiveness |
- Altered layout to enable smooth viewing on both mobile and desktop
- Made the dashboard responsive using viewbox sizing
- Changed the default map base layer at base-map-chart.js
- Removed heatmap to speed up yearly and monthly analysis
- Checked To-do's for Dashboard I
- Refactor the code using functional programming eg. using transducers
- Add capability to filter data by clicking the legend ranges, potential solutions - filtering map markers, filter leaflet maps with a slider, and filtering data in leaflet
- Add sidebar to house additional features, helpers - How To - Side Navigation and How to think like a programmer
- Paginate the row chart
- Update the data
- Improve user interaction experience for mobile
- Unchecked To-do's from Dashboard I
- Apply Joey Cherdarchuk findings
