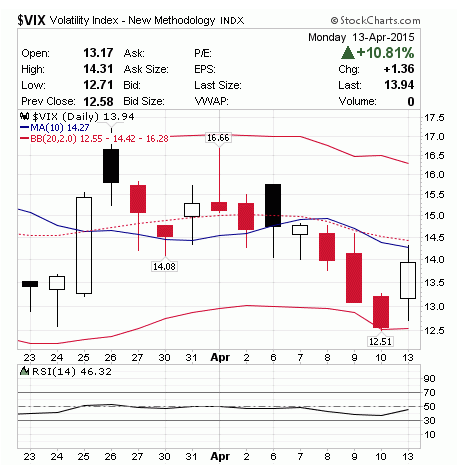
The purpose of this repository is to to provide an example of using streamlit to the students.
The source code uses Yahoo Finance to get the vix prices. The data is gotten by using a python library called yfinance.
The library enables us to get stock data from Yahoos publicly available APIs.
To read more about yfinance, head to https://aroussi.com/post/python-yahoo-finance
After fetching the data, we calculate whetever today is day when the user should either buy, sell, or do nothing.
This is then presented to the user using streamlit
To get started, make sure you have python 3 installed. Install the required packaged either with conda, or with pip.
Run the command:
conda env create -f environment.ymlRun the command:
python3 -m pip install -r requirements.txtEnter the folder where you have downloaded the code, and open a terminal in the current folder. For a guide, take a look at the following guide: https://www.groovypost.com/howto/open-command-window-terminal-window-specific-folder-windows-mac-linux/
NOTE: In Windows, you might have to use the anaconda prompt instead of the command prompt or powershell.
To run the streamlit version of the app, run the command:
If you used conda, you need to enter your environment by doing the following:
conda activate vix-envNormal example:
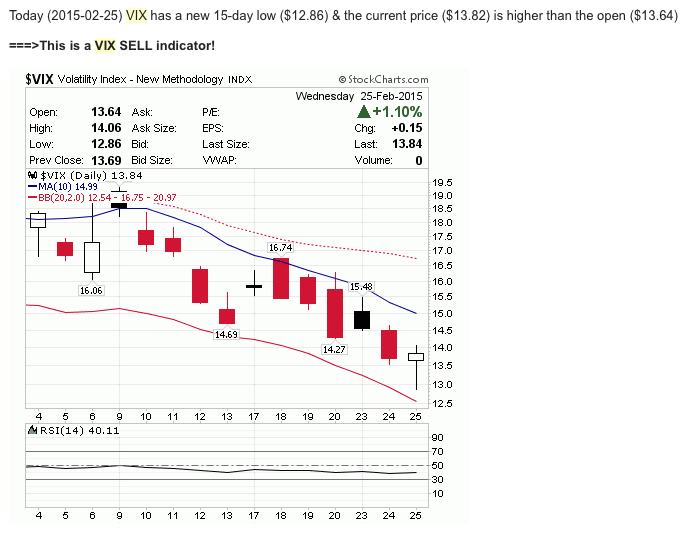
Sell indicator example:


