The goal of runway is to generate statistics and plots to calculate discrimination, calibration, and decision curves for prediction models.
Because you can use it to visually compare models.
Sometimes your models look quite different.
Other times your models look the same…
You can install runway from GitHub with:
remotes::install_github('ML4LHS/runway')First, load the package.
library(runway)Runway comes with two sample datasets.
data(single_model_dataset)
head(single_model_dataset)
#>   outcomes predictions
#> 1        0        0.36
#> 2        1        0.31
#> 3        0        0.39
#> 4        0        0.09
#> 5        0        0.44
#> 6        1        0.22

data(multi_model_dataset)
head(multi_model_dataset)
#>   outcomes predictions model_name
#> 1        0        0.26    Model 2
#> 2        1        0.28    Model 1
#> 3        0        0.56    Model 2
#> 4        0        0.27    Model 1
#> 5        0        0.31    Model 1
#> 6 0 0.42 Model 2threshperf_plot(single_model_dataset,
outcome = 'outcomes',
prediction = 'predictions')Note: 10 bins is the default.
cal_plot(single_model_dataset,
         outcome = 'outcomes',
prediction = 'predictions')cal_plot(single_model_dataset,
outcome = 'outcomes',
prediction = 'predictions',
n_bins = 5)cal_plot(single_model_dataset,
outcome = 'outcomes',
prediction = 'predictions',
show_loess = TRUE)cal_plot(single_model_dataset,
outcome = 'outcomes',
prediction = 'predictions',
n_bins = 0,
show_loess = TRUE)threshperf_plot_multi(multi_model_dataset,
outcome = 'outcomes',
prediction = 'predictions',
model = 'model_name')Note: 10 bins is the default.
cal_plot_multi(multi_model_dataset,
         outcome = 'outcomes',
         prediction = 'predictions',
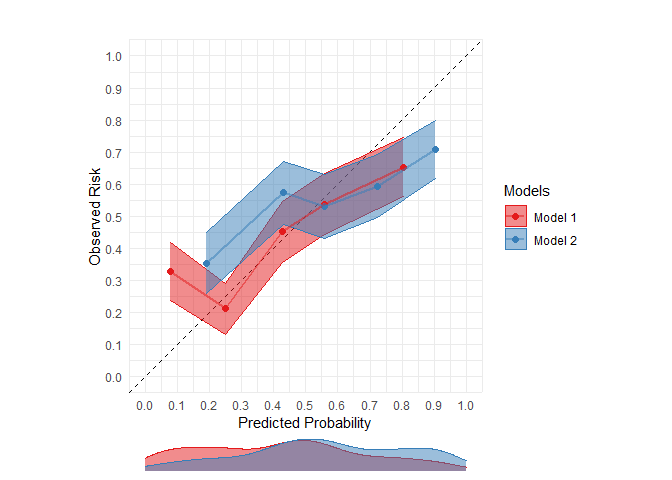
model = 'model_name')cal_plot_multi(multi_model_dataset,
outcome = 'outcomes',
prediction = 'predictions',
model = 'model_name',
n_bins = 5)Unlike single calibration plots, the choice of binned calibration and
loess calibration are mutually exclusive. To show LOESS curves, you must
set show_loess to TRUE and n_bins to 0.
cal_plot_multi(multi_model_dataset,
         outcome = 'outcomes',
         prediction = 'predictions',
         model = 'model_name',
         n_bins = 0,
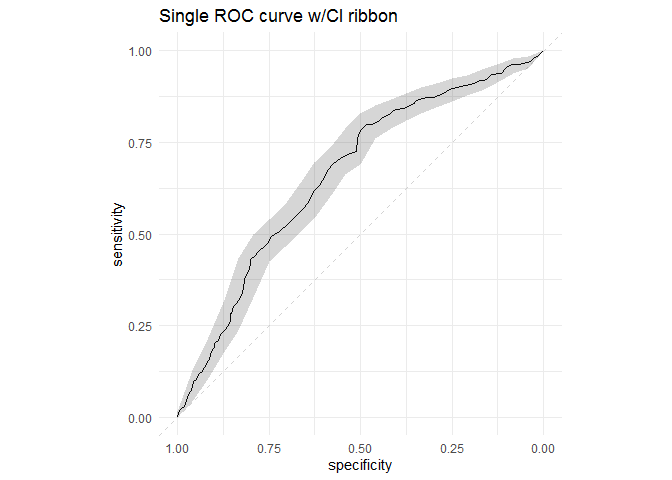
show_loess = TRUE)roc_plot(single_model_dataset,
outcome = 'outcomes',
prediction = 'predictions',
ci = TRUE,
plot_title = 'Single ROC curve w/CI ribbon')roc_plot_multi(multi_model_dataset,
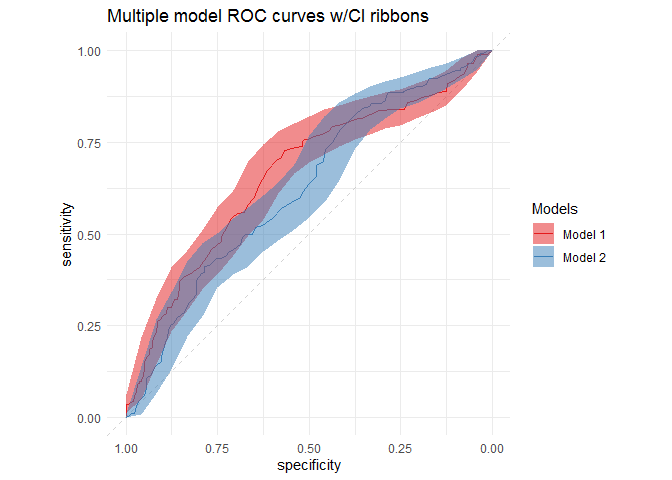
outcome = 'outcomes',
prediction = 'predictions',
model = 'model_name',
ci = TRUE,
plot_title = 'Multiple model ROC curves w/CI ribbons')


