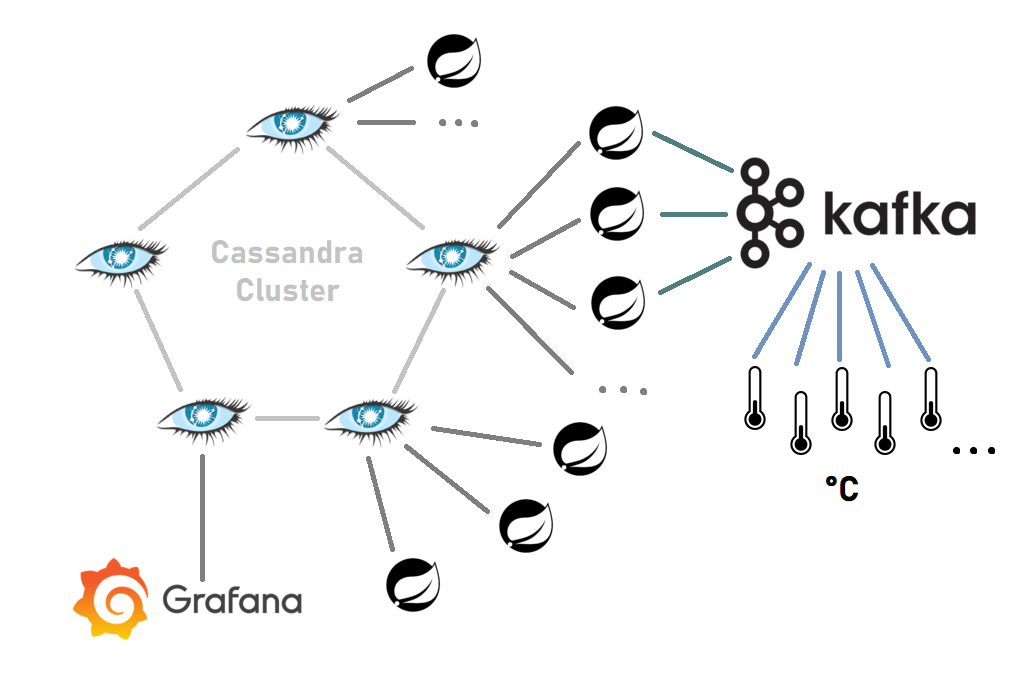
BigMetric is a Proof of Concept to test a scalable network of temperature sensors located worldwide.
Theoretically, if implemented correctly, it should be able to handle up to 1 million devices,
that send their °C temperature every ~10 seconds.

In my PoC the infrastructure deployment is rough, everything runs in Docker containers on a local machine and therefore cannot be expanded too much.
If you opt for a good on-premise deployment, there are many opportunities for scalability using Kubernetes when the sensor network grows. Since each Spring microservice is independent of each other, with Kubernetes simply add more of them, and they will take the input data from the Apache Kafka cluster. Then, simply add more Cassandra and Kafka nodes to their clusters, as the performance increase is nearly linear when you add more nodes (horizontal scaling).
We can migrate this PoC to use cloud providers services and have an easy way to automatically scale based on load. The possible solution is to use a managed Kubernetes service such as GKE to manage the deployment of Java Spring microservices, or even a serverless solution, if it's cheaper, in that way it will be executed only when there are data to process. Also, instead of a Cassandra cluster we can opt for something similar, such as Google BigTable or Amazon DynamoDB, and Google Cloud Pub/Sub can replace Apache Kafka.
The data that needs to be saved in the database is basically time series data, and therefore it is necessary to handle such data in our application. In addition, as per the initial specifications, the application must be scalable and handle up to 1 million sensors simultaneously.
Therefore, Apache Cassandra seems to be a good compromise between the two, if the cluster capacity is saturated, just add another node and the performance increases (Here is a good guide to design a time series DB).
There is a need for middleware that handles the data collected from the sensors, filters it, processes it by converting it to a compatible format, and saves it to the database. It was decided to adopt a filter on temperature values in °C, which can be set in the environment variables and allows discarding outliers that are likely to come from an incorrect reading. It was decided to take an approach where there are multiple deployments of a microservice written in Java Spring (but other languages/frameworks are fine as well) and the data is split between instances to increase throughput.
There could be several ways to transfer data from the various sensors to the service responsible for processing them, including RPC, a REST API, or a message queue. In this case we can use Apache Kafka as a message queue, and it looks good because it is asynchronous and allows handling large amounts of data, with the possibility of adding more nodes to increase the capability.
An alternative would be to use a load balancer with a REST API to connect the sensor with the microservice that processes the data, but this would be more complex to manage in the long run and does not scale as well as in a message queue, which allows the data producer to be separated from the consumer.
To compensate for the time between the sensor sending the data and when it is saved by the processing service, it is convenient to include the timestamp directly in the message sent in the queue, so you can accurately track when the temperature was actually collected.
Build the Java (Spring Boot) microservice using Gradle:
./gradlew build
Make sure no other copies of the app are running (docker ps and docker rm -f <ids>).
Start the application stack:
docker compose up
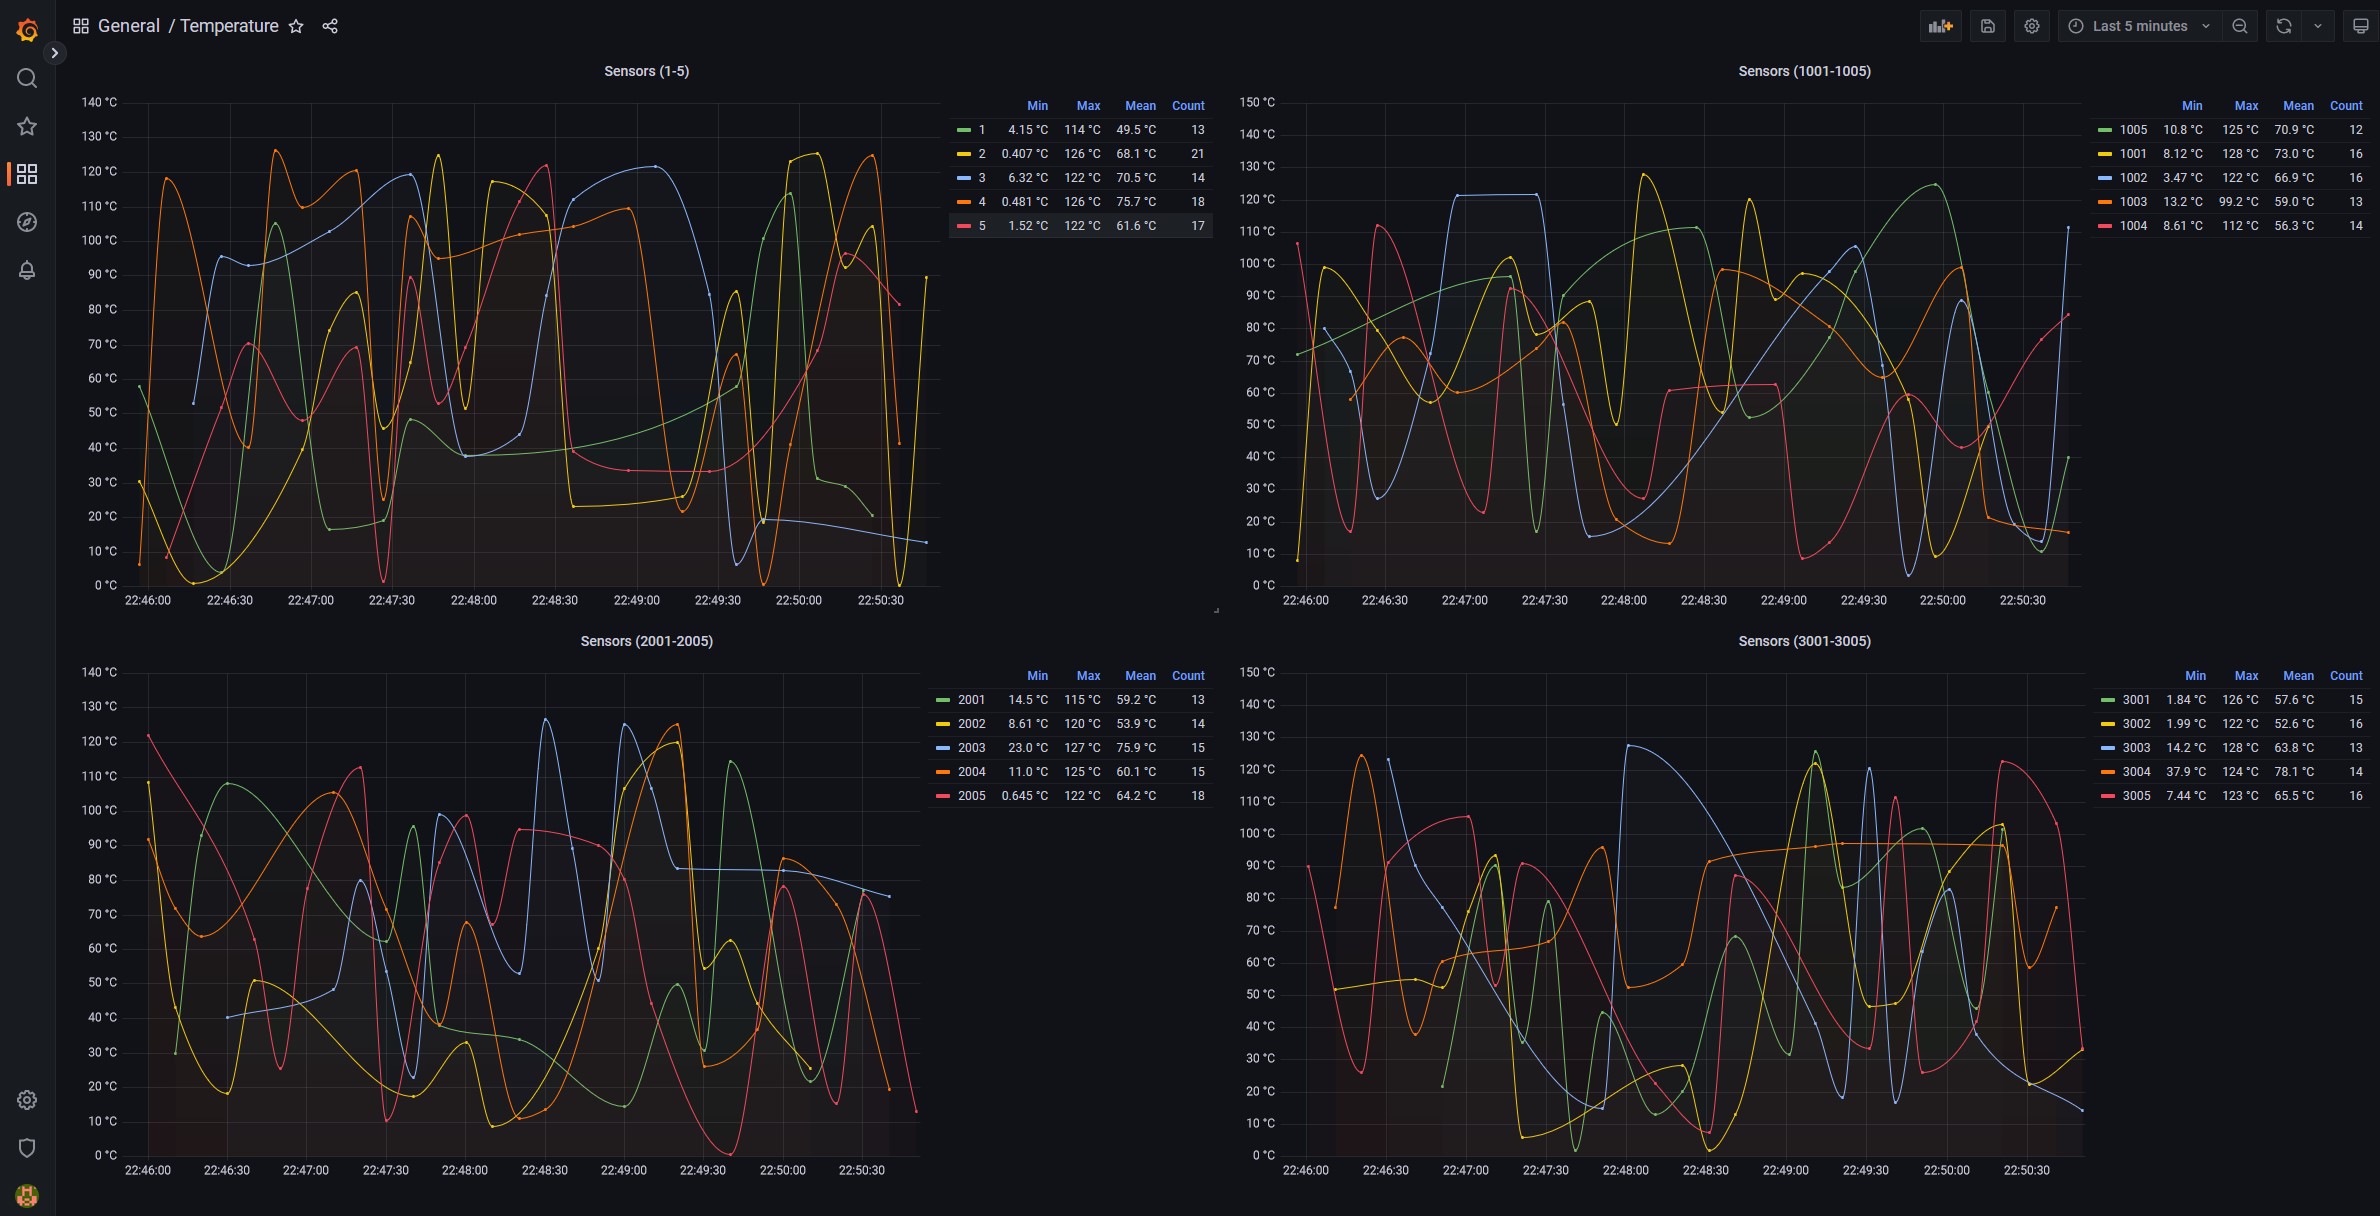
Grafana was chosen to display some graph on changes in sensor data over time. The tool takes data directly from the Cassandra cluster using some CQL (Cassandra Query Language) queries written for this project, over the time frame considered.
To access Grafana UI:
- Port 3001 in the browser (
localhost:3001) - Username & password:
adminadmin
