library(tidyverse )
# > ── Attaching core tidyverse packages ──────────────────────── tidyverse 2.0.0 ──# > ✔ dplyr 1.1.0 ✔ readr 2.1.4# > ✔ forcats 1.0.0 ✔ stringr 1.5.0# > ✔ ggplot2 3.4.1 ✔ tibble 3.2.0# > ✔ lubridate 1.9.2 ✔ tidyr 1.3.0# > ✔ purrr 1.0.1 # > ── Conflicts ────────────────────────────────────────── tidyverse_conflicts() ──# > ✖ dplyr::filter() masks stats::filter()# > ✖ dplyr::lag() masks stats::lag()# > ℹ Use the conflicted package (<http://conflicted.r-lib.org/>) to force all conflicts to become errorsggfips )
us_census %> %
ggplot() +
coord_sf() +
aes(fips = fips ) +
aes(fill = mean_work_travel ) +
geom_sf_county() +
scale_fill_viridis_c(option = " magma" # > Joining with `by = join_by(fips)`
us_census %> %
ggplot() +
coord_sf() +
aes(fips = fips ) +
aes(fill = mean_work_travel ) +
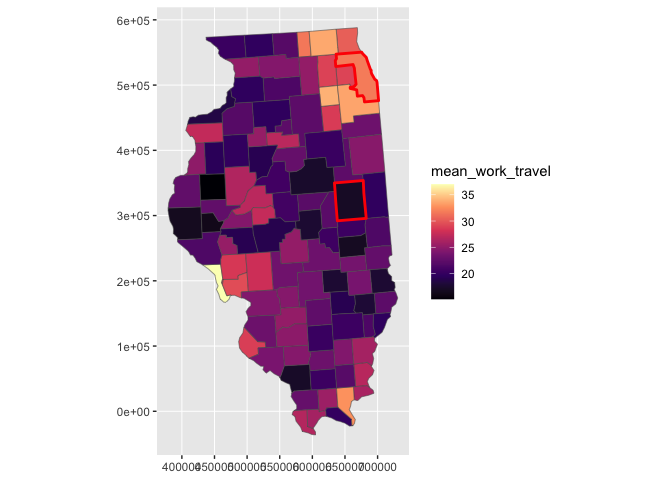
geom_sf_county(state = " Illinois" +
scale_fill_viridis_c(option = " magma" # > Joining with `by = join_by(fips)`
last_plot() +
geom_sf_county(state = " Illinois" county = c(" Cook" " Champaign" color = " red" linewidth = 1 )
# > Joining with `by = join_by(fips)`# > Joining with `by = join_by(fips)`
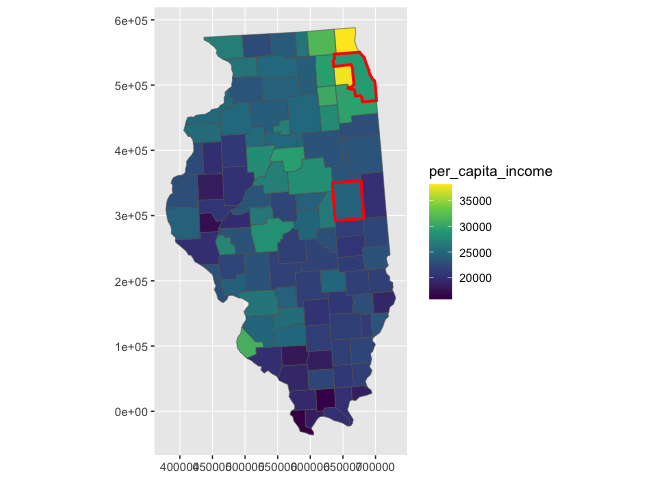
# aesthetic mapping quick change+
aes(fill = per_capita_income ) +
scale_fill_viridis_c()
# > Scale for fill is already present.# > Adding another scale for fill, which will replace the existing scale.# > Joining with `by = join_by(fips)`# > Joining with `by = join_by(fips)`
us_census %> %
ggplot() +
coord_sf() +
aes(fips = fips ) +
aes(fill = mean_work_travel ) +
geom_sf_county(state = " Texas" +
scale_fill_viridis_c(option = " magma" # > Joining with `by = join_by(fips)`
us_census %> %
ggplot() +
coord_sf() +
aes(fips = fips ) +
aes(fill = mean_work_travel ) +
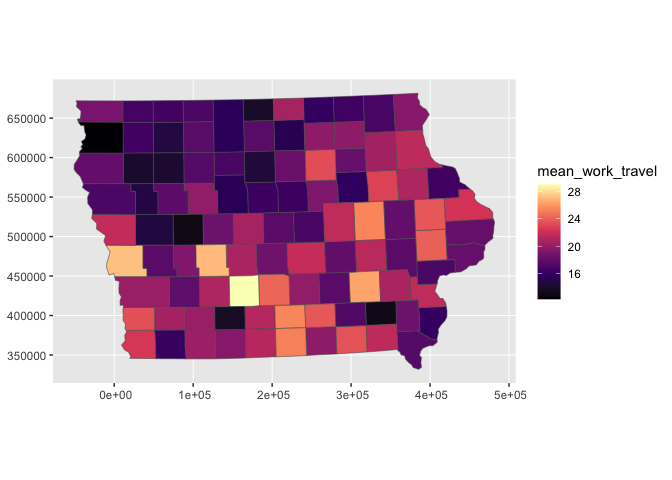
geom_sf_county(state = " Iowa" +
scale_fill_viridis_c(option = " magma" # > Joining with `by = join_by(fips)`
us_census %> %
ggplot() +
coord_sf() +
aes(fips = fips ) +
aes(fill = mean_work_travel ) +
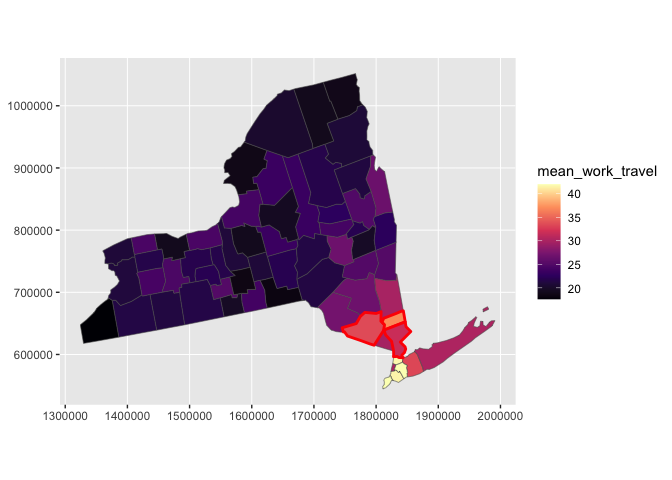
geom_sf_county(state = " New York" +
scale_fill_viridis_c(option = " magma" +
geom_sf_county(state = " New York" county = c(" Orange" " Putnam" " Westchester" color = name ),
color = " red" linewidth = 1 )
# > Joining with `by = join_by(fips)`# > Joining with `by = join_by(fips)`


