Android applications performance testing tool.
#Usage There are two ways to use probe:
-
As a command line tool. This will run a basic test case of Restart ----> Steady state
# python console.py --package your.package.name --activity TheActivityToRunProbeOn --repeat-count x --timeout y

# python console.py --help

Options:
  --package TEXT          Package name to run Probe on
  --activity TEXT         Activity to restart within that package
  --apk-path TEXT         Optional: Path to installed APK, if you want APK analisys
  --repeat-count INTEGER  Times to repeat the test
  --timeout INTEGER       probe will stop when logcat output is silent for
                          that duration
  --device-id TEXT        device_id to send commands to
-
As a python module, as a part of your UI tests start probe at the begining of each test, and stop in when it ends (the following example shows how we did that with Magneto, setting up probe inside our
BaseTestCasefrom probe.probe import Probe class BaseTestCase(TestCase): probe = None def setup_method(self, method): super(BaseTestCase, self).setup_method(method) self.probe = Probe(package, activity, device_id) probe.start() def teardown_method(self, method): super(BaseTestCase, self).teardown_method(method) self.probe.stop()
##Background In EverythingMe we used to have "performance blitzs" every now and then, when we (subjectivly) felt EverythingMe's launcher performance is not on par with what we would expect it to be. Then we would start manually measuring the app's vital signs using the following tools:
-
Memory utilization - Dalvik, Native, PSS total:
adb shell dumpsys meminfo app.package.name
-
CPU utilization - this one is tricky, you can certainly measure it with
top, but in order to calculate "how much processing power was needed to complete the task you'd need to sum up the instantaneous CPU usage for the entire duration of the measurement. Instead, I chose to measure CPU ticks using data from proc statcat proc/{pid}/stat -
Disk usage - well, a simple
ducovers itdu -s /data/data/{package_name} -
Thread count - using
top(#THR column) -
a lot more - with Android Studio's new(ish) tools, MAT and numerous logcat logs.
You are probably familiar with the huge amount of repetative work when doing such measurements and even though this is a tedious process, the collected results worth nothing without a comparison to previous measurements. This is where probe gets in the picture.
probe is desigend to measure these vital signs mentioned above (and much more), as a cli tool or as a python module.
##How does it work
Probe is designed to measure everything* automatically, and by everything I mean anything that has a logcat output or which can be queried using adb (dumpsys, dumpheap, profile, etc.) or a linux command (du, cat, top, etc.)
Each measurer registers to a certain registar, and the latter in turn triggers that measurer to do something.
There are three types of registrars:
##Registrars
Registars are metaclasses. when a class's metaclass is being set to be a registrar, it is automatically being registered to start/stop events and logcat output events.
SnapshotRegistrar: more here soon
ContinuousRegistrar: more here soon
GlobalRegistrar: more here soon
##Measurers
The actual code which collects the data is written here.
Snapshot measurers: When probe is triggered to stop measuring, it begins collecting data from all measurers registered to SnapshotRegistrar. It may get an instantaneous value of a measurer (current memory utilization, number of threads, CPU ticks, etc.)
Continuous measurers: When probe starts, it triggers an adb logcat instance. This instance output is being passed line by line to all measurers which registered to the ContinuousRegistrar. Each measurer filters relevant logcat lines using is_matching(line) function, and processes then in process(line). The measurer handles its own state machine (whether its a simple line counter which only measures the amount of processed lines, or a more complicated one measuring the frequency of GC_FOR_ALLOC lines).
Global measurers: A combination of both, a Continuous measurer, receiving relevant logcat lines, processing them (either just counting occurrences of this logcat line, or triggering a small state machine in it). the registar then takes a snapshot of what it accumulated when probe triggers it to stop.
- Writing new measurers:
This is how a measurer looks like:
```python
class CpuTicksUser(object):
   """
   Cpu usage - user space (in ticks)
   """
   PROC_STAT_USER_TICKS_LOC = 13

   __metaclass__ = SnapshotRegistrar

   def __init__(self):
       pass

   def name(self):
	   """
	   the key of this measurement in the output dict
	   """
       return 'cpu_ticks_user'

   def value(self):
	   """
	   the value of this measurement in the output dict
	   """
   		pid = runtime.get_instance().get_pid()
   		procstat = adb.get_instance().shell('cat /proc/%s/stat' % pid)['stdout'][0].split()
   		return int(procstat[PROC_STAT_USER_TICKS_LOC])
```
Probe writes output to a provided DB (or a local sql lite (mydatabase.db) if no connection string is provided.
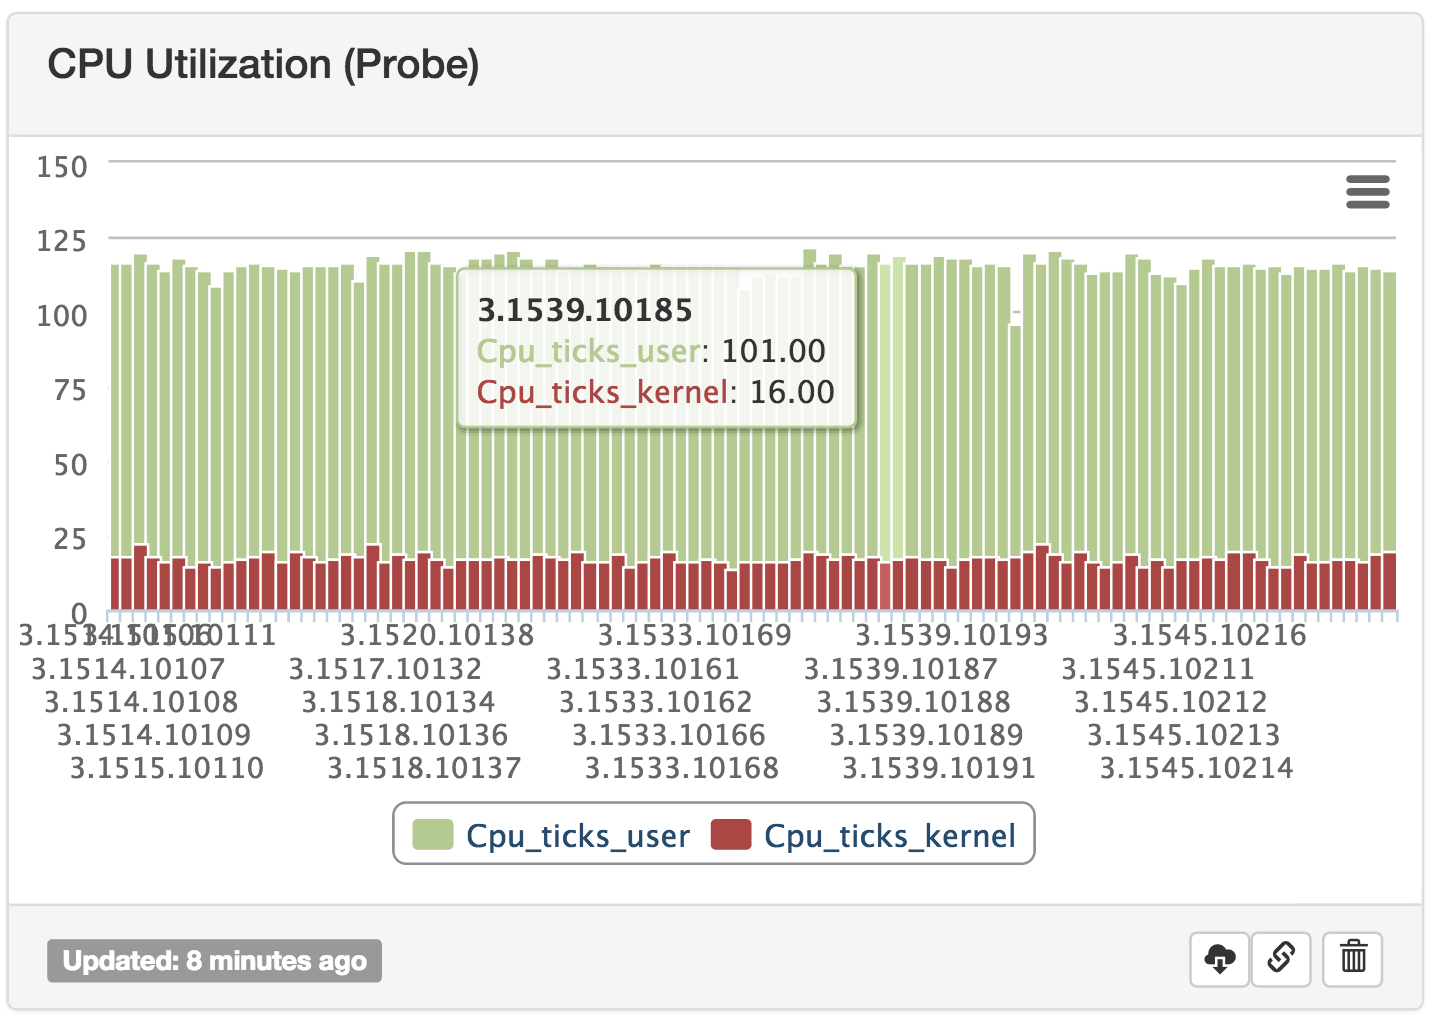
querying probe's db for cpu_ticks (both user and kernel ticks) values in last 100 builds:
SELECT p.Build_number, version_code, Cpu_ticks_user, Cpu_ticks_kernel FROM collector p
JOIN ((SELECT Build_number, max(Created_at) as max_time
FROM collector
GROUP BY Build_number)) m ON (p.Build_number=m.Build_number and p.created_at=m.max_time)
ORDER BY p.Build_number desc
LIMIT 100
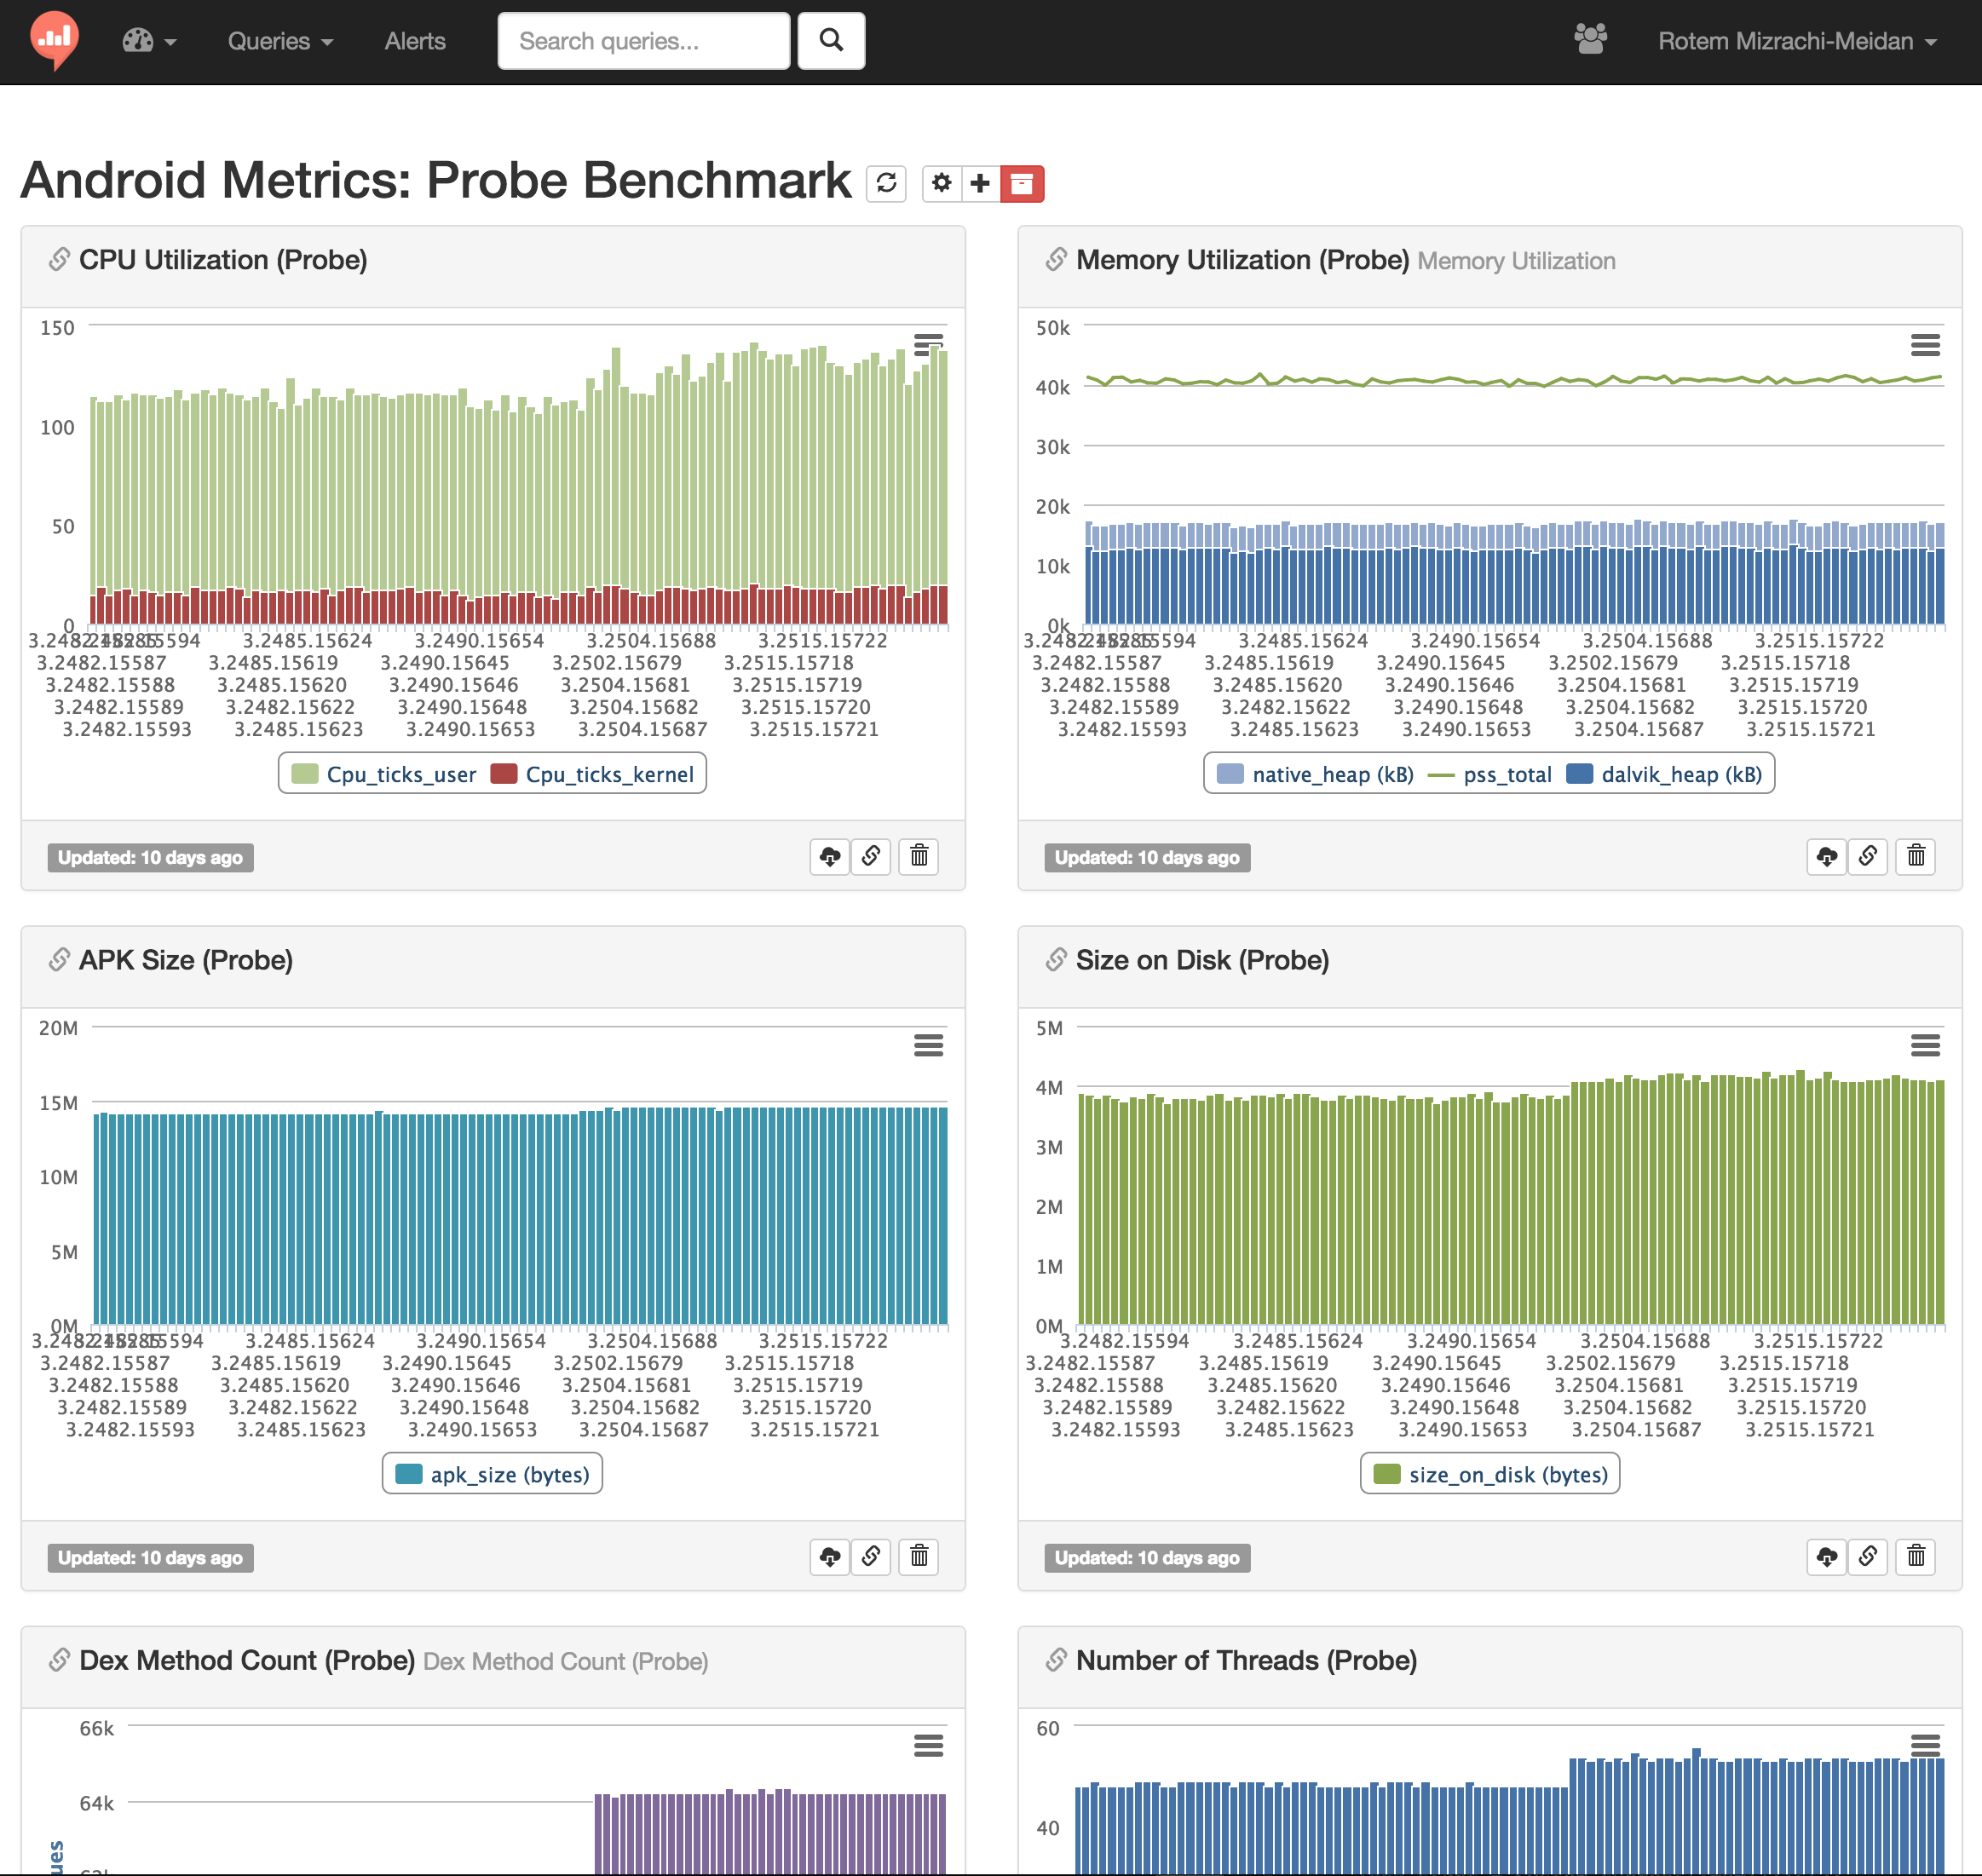
And that's how it looks like in redash:

It is important to emphesize that probe is a benchmark to itself! meaning it needs to run consecutively on the same device in order to produce valid results (of course SGS4 would have a higher PSS total value than SGS3, it has 225% the pixle count of SGS3).
##Some more graphs
or "this is what we measured on EverythingMe Launcher"
