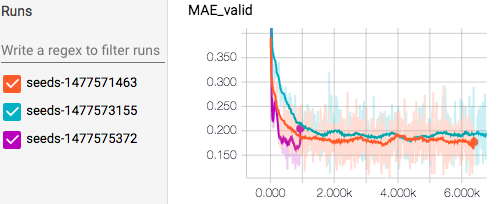

TensorBoard is a visualization tool (not this project, it's a part of TensorFlow framework) that makes it easy to check training progress, compare between different runs, and has lots of other cool features.
tensorboard_logger library allows to write TensorBoard events without TensorFlow:
from tensorboard_logger import configure, log_value

configure("runs/run-1234")

for step in range(1000):
    v1, v2 = do_stuff()
    log_value('v1', v1, step)
    log_value('v2', v2, step)
Note: if you are already using TensorFlow in your project, you probably don't need this library.
TensorFlow is required only for viewing logged events: please check installation guide on the official site (you probably want a CPU-only version).
tensorboard_logger can be installed with pip:
pip install tensorboard_logger
You can either use default logger with tensorboard_logger.configure
and tensorboard_logger.log_value functions, or use tensorboard_logger.Logger class.
This library can be used to log numerical values of some variables in TensorBoard format, so you can use TensorBoard to visualize how they changed, and compare same variables between different runs. Log file is written into a directory, so you need a separate directory for each run (you can place other logs or output files you use in the same directory). Directories from different runs you wish to compare should have the same parent (there can be other files or directories with the same parent, TensorBoard will figure out which directories contain logs).
Apart from variable names and their values, another important thing is the step: this must be an integer that represents some increasing step - it can be a step in training or some other number. The values are ordered by step in TensorBoard, although you can view them ordered by time or relative step too.
A simple usage example:
from tensorboard_logger import configure, log_value

configure("runs/run-1234", flush_secs=5)

for step in range(1000):
    v1, v2 = do_stuff()
    log_value('v1', v1, step)
    log_value('v2', v2, step)
You can start TensorBoard right away:
tensorboard --logdir runs
And go check the metrics to TensorBoard UI at http://localhost:6006 (note that it binds to 0.0.0.0 by default). Metrics are refreshed on switch to browser tab, and there is also a refresh button at the top right.
Runtime overhead rather large, about 0.1 - 0.2 ms for a single value logged (so about 5,000 - 10,000 operations per second).
tensorboard_logger.configure(logdir, flush_secs=2)
Configure logging: a file will be written to logdir, and flushed every flush_secs.
NOTE: right now file is flushed after each event written.
tensorboard_logger.log_value(name, value, step=None)
Log new value for given name on given step.
value should be a real number (it will be converted to float),
and name should be a string (it will be converted to a valid
TensorFlow summary name). step should be an non-negative integer,
and is used for visualization: you can log several different
variables on one step, but should not log different values
of the same variable on the same step (this is not checked).
You can also omit step entirely.
tensorboard_logger.Logger
A class for writing logs in a directory.
Use it if default logger used in two above functions is not enough for you
(e.g. you want to log into several different directories, or don't like
global variables).
Constructor has the same signature as tensorboard_logger.configure,
and it has a single log_value method with the same signature as
tensorboard_logger.log_value.
Compiling python protobuf files:
protoc --python_out . tensorboard_logger/tf_protobuf/summary.proto
protoc --python_out . tensorboard_logger/tf_protobuf/event.proto
MIT license
