LineVis is a visualization tool for rendering dense sets of 3D lines using the graphics API Vulkan. It supports loading both traditional flow lines as well as stress lines from multiple principal stress directions.

From left to right:
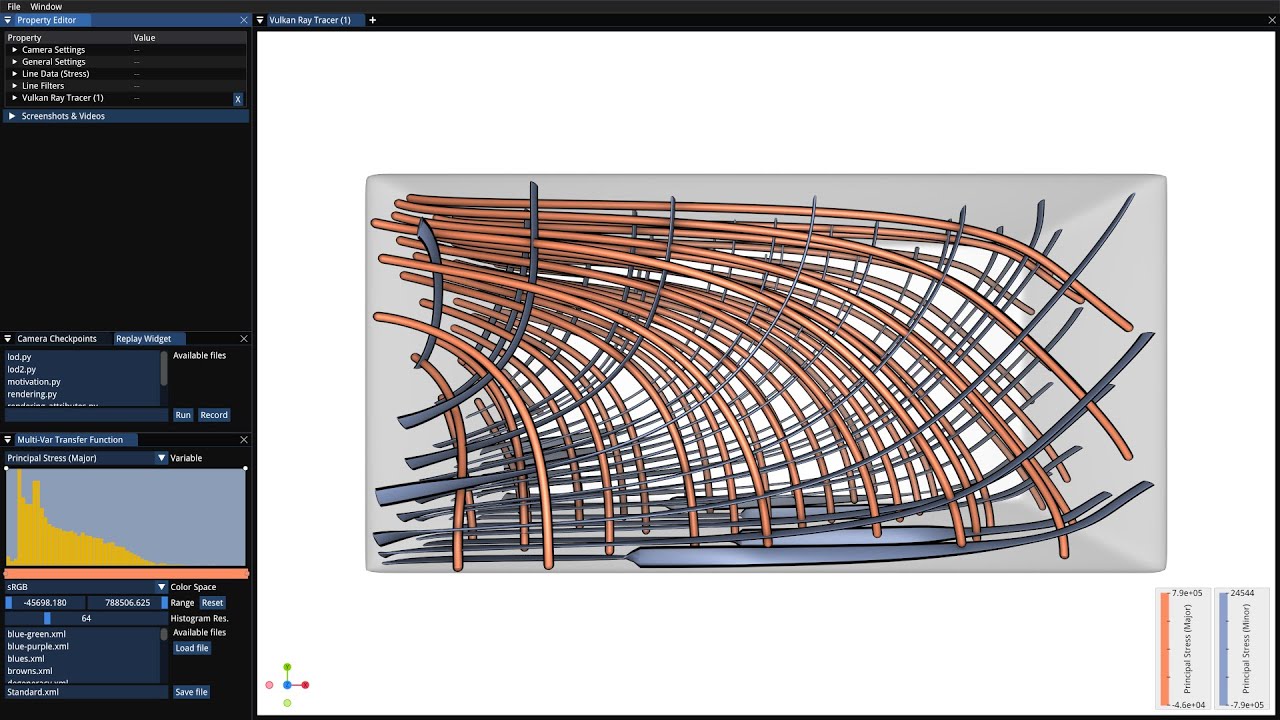
- Rayleigh–Bénard convection data set [Pandey et al. 2018] rendered using a Vulkan ray tracer with ray traced ambient occlusion (RTAO).
- Tornado data set [Crawfis 2003] rendered using decoupled opacity optimization [Günther et al. 2017, see below].
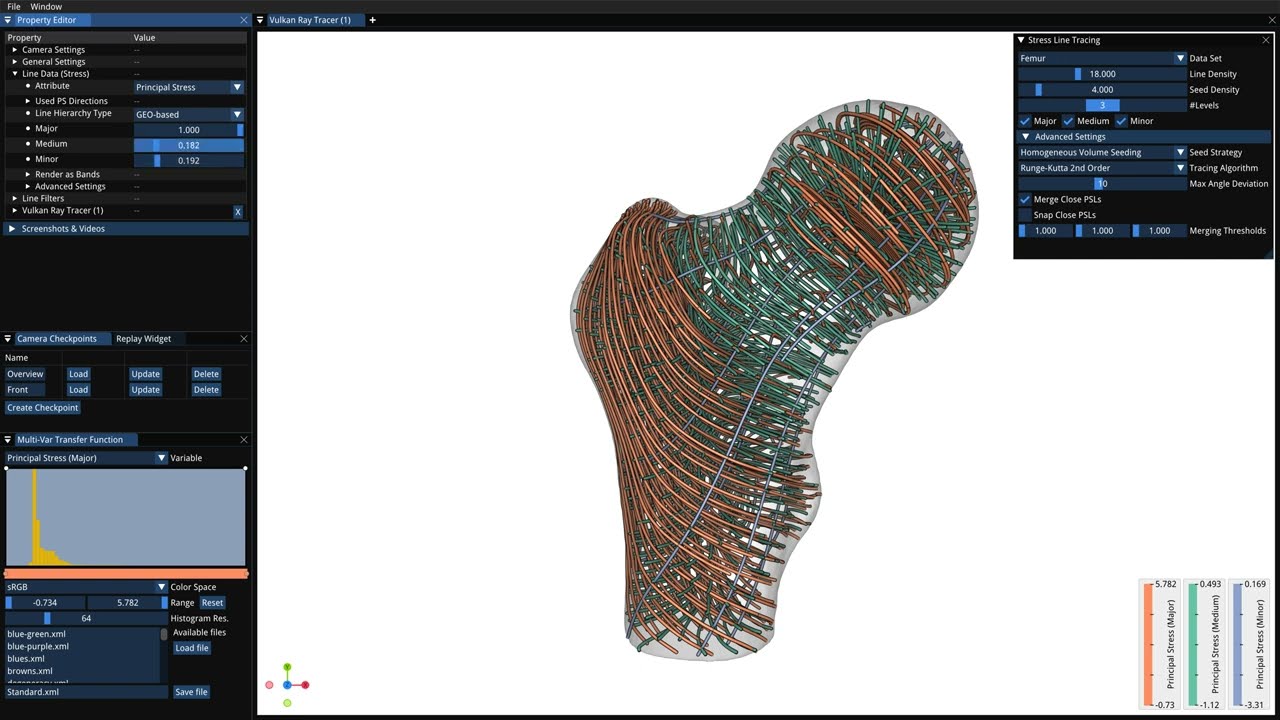
- Femur data set [Wu et al. 2018]. Principal stress lines generated using 3D-TSV.
[Crawfis 2003]: Roger Crawfis. 2003. Tornado Data set generator. http://web.cse.ohio-state.edu/~crawfis.3/Data/Tornado/
[Pandey et al. 2018]: Ambrish Pandey, Janet D. Scheel, and Jörg Schumacher. 2018. Turbulent superstructures in Rayleigh-Bénard convection. Nature Communications 9, 1 (May 2018). https://doi.org/10.1038/s41467-018-04478-0
[Wu et al. 2018]: J. Wu, N. Aage, R. Westermann and O. Sigmund, "Infill Optimization for Additive Manufacturing - Approaching Bone-Like Porous Structures," in IEEE Transactions on Visualization and Computer Graphics, vol. 24, no. 2, pp. 1127-1140, 1 Feb. 2018, doi: 10.1109/TVCG.2017.2655523.
There are two ways to build the program on Linux systems.
- Using the system package manager to install the dependencies (tested: apt on Ubuntu, pacman on Arch Linux).
- Using vcpkg to install the dependencies.
In the project root directory, two scripts build-linux.sh and build-linux-vcpkg.sh can be found. The former uses the
system package manager to install all dependencies, while the latter uses vcpkg. The build scripts will also launch the
program after successfully building it. If you wish to build the program manually, instructions can be found in the
directory docs/compilation.
Below, more information concerning different Linux distributions tested can be found.
Arch Linux and its derivative Manjaro are fully supported using both build modes (package manager and vcpkg).
The Vulkan SDK, which is a dependency of this program that cannot be installed using vcpkg, will be automatically
installed using the package manager pacman when using the scripts.
Ubuntu 20.04 and 22.04 are fully supported.
The Vulkan SDK, which is a dependency of this program that cannot be installed using the default package sources or vcpkg, will be automatically installed using the official Vulkan SDK PPA.
Please note that Ubuntu 18.04 is only partially supported. It ships an old version of CMake, which causes the build process using vcpkg to fail if not updating CMake manually beforehand.
If you are using a different Linux distribution and face difficulties when building the program, please feel free to open a bug report. In theory, the build scripts should also work on other Linux distributions as long as the Vulkan SDK is installed manually beforehand.
There are two ways to build the program on Windows.
- Using vcpkg to install the dependencies. The program can then be compiled using Microsoft Visual Studio.
- Using MSYS2 to install the dependencies and compile the program using MinGW.
In the project folder, a script called build-windows.bat can be found automating this build process using vcpkg and
Visual Studio. It is recommended to run the script using the Developer PowerShell for VS 2022 (or VS 2019 depending on
your Visual Studio version). The build script will also launch the program after successfully building it.
Building the program is regularly tested on Windows 10 and 11 with Microsoft Visual Studio 2019 and 2022.
Please note that the Vulkan SDK needs to be installed beforehand if using Microsoft Visual Studio for compilation.
A script build-windows-msys2.bat is also available to build the program using MSYS2/MinGW alternatively to using
Microsoft Visual Studio.
If you wish to build the program manually using Visual Studio and vcpkg, or using MSYS2, instructions can be found in
the directory docs/compilation.
There are two ways to build the program on macOS.
- Using Homebrew to install the dependencies and compile the program using LLVM/Clang (recommended).
- Using vcpkg to install the dependencies and compile the program using LLVM/Clang.
In the project root directory, two scripts build-macos-vcpkg.sh and build-macos-brew.sh can be found.
As macOS does not natively support Vulkan, MoltenVK, a Vulkan wrapper based on Apple's Metal API, is utilized.
Installing it via the scripts requires admin rights. MoltenVK can also be installed manually from
the website.
The program can only run with reduced feature set, as the Metal API does currently neither support geometry shaders nor hardware-accelerated ray tracing.
Notes:
- I rented Apple hardware for a few days once for testing that running the program works on macOS. As I do not regularly have access to a real system running macOS, it is only tested that the program can compile in a CI pipeline build script on an x86_64 macOS virtual machine provided by GitHub Actions. So please note that it is not guaranteed that the program will continue working correctly on macOS indefinitely due to the lack of regular testing.
- To enable high DPI support, the program needs to be run from an app bundle. This happens automatically when the script
build-macos-brew.shhas finished building the program. Please note that the app bundle only contains the Info.plist file necessary for high DPI support and is currently not yet redistributable. If you want to help with improving the macOS app bundle support for this project by contributing development time, please feel free to contact me.
Under Data/LineDataSets/datasets.json, loadable data sets can be specified. Additionally, the user can also open
arbitrary data sets using a file explorer via "File > Open Dataset..." (or using Ctrl+O).
Below, an example for a Data/LineDataSets/datasets.json file can be found.
{
    "datasets": [
        { "type" : "flow", "name" : "Rings", "filenames": "flow/rings.obj", "linewidth": 0.003, "attributes": "Vorticity" },
        { "type" : "flow", "name" : "Tornado", "filenames": "flow/tornado.obj", "linewidth": 0.003, "attributes": "Vorticity" },
        { "type" : "flow", "name" : "Aneurysm", "filenames": "flow/aneurysm.obj", "attributes": "Vorticity" },
        { "type" : "flow", "name" : "Convection Rolls", "filenames": "flow/convection_rolls.obj", "attributes": "Line Curvature" },
        { "type" : "flow", "name" : "Turbulence", "filenames": "flow/turbulence.obj", "attributes": "Lambda_2 Vortex Measure" },
        { "type": "stress", "name": "Bearing",
          "filenames": "stress/bearing_psl.dat", "transform": "rotate(270°, 1, 0, 0)", "version": 3 },
        { "type": "stress", "name": "Cantilever",
          "filenames": "stress/cantilever3D_psl.dat", "transform": "rotate(270°, 1, 0, 0)", "version": 3 }
    ]
}
These files then appear with their specified name in the menu "File > Datasets". All paths must be specified relative to
the folder Data/LineDataSets/ (unless they are global, like C:/path/file.dat or /path/file.dat).
Supported formats currently are:
- .obj, .nc (NetCDF format), and the custom .binlines format for flow lines and ribbons.
- .dat files for principal stress lines (PSLs), stress ribbons and hyperstreamlines.
The format of the .obj files is expected to be as follows.
v <x> <y> <z> # vertex at index 1
vt <attribute>
...
g line0
l <v_idx_1> <v_idx_2> ... <v_idx_n>
...
This program can be used as the frontend for 3D-TSV, the 3D Trajectory-based Stress Visualizer.
For this, select "Stress Line Tracer" in the menu "File > Datasets" to open the line tracing menu.
When the 3D-TSV script TSV3D_server.m is running in the background, this application will then communicate with
3D-TSV over TCP/IP using ZeroMQ.
The repository of the backend can be found here: https://github.com/Junpeng-Wang-TUM/3D-TSV
3D-TSV is a visual analysis tool for the exploration of the principal stress directions in 3D solids under load. It was created for the paper "3D-TSV: The 3D Trajectory-based Stress Visualizer" by Junpeng Wang, Christoph Neuhauser, Jun Wu, Xifeng Gao and Rüdiger Westermann (https://www.sciencedirect.com/science/article/pii/S0965997822000552).
Under Data/LineDataSets/mesh.json, available simulation meshes can be specified. For example, when using the sample
meshes of 3D-TSV, the following file content can be specified:
{
  "meshes": [
    { "name": "Cantilever", "filename": "../../../data/stress/ADES-2022/cantilever3D.carti" },
    { "name": "Kitten", "filename": "../../../data/stress/ADES-2022/kitten.stress" }
  ]
}
Additionally, the user can also open arbitrary simulation meshes (in .carti or .stress format) and
principal stress line (PSL) data sets using a file explorer via "File > Open Dataset..." (or using Ctrl+O).
.carti and .stress files will then be opened in the stress line tracing dialog.
Below, a list of rendering modes supported in LineVis can be found.
-
Opaque line rendering with up to 8x MSAA (multisample anti-aliasing).
-
Opaque and transparent line rendering using a ray tracer based on the Vulkan Ray Tracing extension. Both ray-triangle and analytic ray-tube intersections can be used.
-
Opaque line rendering with Voxel Ray Casting (VRC). For more details see: M. Kanzler, M. Rautenhaus, R. Westermann. A Voxel-based Rendering Pipeline for Large 3D Line Sets. IEEE Transactions on Visualization and Computer Graphics 2018. https://www.in.tum.de/cg/research/publications/2018/a-voxel-based-rendering-pipeline-for-large-3d-line-sets/
-
Opaque and transparent line rendering using Intel OSPRay.
-
Transparent line rendering with per-pixel fragment lists (sometimes also called per-pixel linked lists). For more details see: Yang, J. C., Hensley, J., Grün, H. and Thibieroz, N., "Real-Time Concurrent Linked List Construction on the GPU", Computer Graphics Forum, 29, 2010.
-
Transparent line rendering with Moment-based Order-Independent Transparency (MBOIT). For more details see: C. Munstermann, S. Krumpen, R. Klein, and C. Peters, "Moment-based order-independent transparency," Proceedings of the ACM on Computer Graphics and Interactive Techniques, vol. 1, no. 1, pp. 7:1–7:20, May 2018.
-
Transparent line rendering with Multi-Layer Alpha Blending (MLAB). For more details see: Marco Salvi and Karthik Vaidyanathan. 2014. Multi-layer Alpha Blending. In Proceedings of the 18th Meeting of the ACM SIGGRAPH Symposium on Interactive 3D Graphics and Games (San Francisco, California) (I3D ’14). ACM, New York, NY, USA, 151–158. https://doi.org/10.1145/2556700.2556705
-
Transparent line rendering with Multi-Layer Alpha Tracing (MLAT). For more details see: F. Brüll and T. Grosch. Multi-Layer Alpha Tracing. In Vision, Modeling, and Visualization. The Eurographics Association, 2020.
-
Transparent line rendering with Multi-Layer Alpha Blending using depth buckets (MLABDB). For more details see: M. Kern, C. Neuhauser, T. Maack, M. Han, W. Usher and R. Westermann, "A Comparison of Rendering Techniques for 3D Line Sets with Transparency," in IEEE Transactions on Visualization and Computer Graphics, 2020. doi: 10.1109/TVCG.2020.2975795 URL: http://ieeexplore.ieee.org/stamp/stamp.jsp?tp=&arnumber=9007507&isnumber=4359476
-
Transparent line rendering with Weighted Blended Order-Independent Transparency (WBOIT) For more details see: Morgan McGuire and Louis Bavoil. 2013. Weighted Blended Order-Independent Transparency. Journal of Computer Graphics Techniques (JCGT), vol. 2, no. 2, 122-141, 201
-
Transparent line rendering with Depth Peeling (DP). For more details see: C. Everitt, "Interactive order-independent transparency", NVIDIA Corporation, vol. 2, 10 2001.
-
Decoupled opacity optimization. Implementation of decoupled opacity optimization as described in: Tobias Günther, Holger Theisel, and Markus Gross. 2017. Decoupled Opacity Optimization for Points, Lines and Surfaces. Comput. Graph. Forum 36, 2 (May 2017), 153–162. DOI:https://doi.org/10.1111/cgf.13115
In the branch https://github.com/chrismile/LineVis/tree/opengl-interop, a legacy version of this program using OpenGL is available. It can be used on old systems that do not support Vulkan 1.1. However, we recommend to first try to update the graphics drivers on systems that have issues with Vulkan, as this might already solve all problems that might eventually occur on older systems.
When reporting a bug, please also attach the logfile generated by LineVis. Below, the location of the logfile on different operating systems can be found.
- Linux:
~/.config/linevis/Logfile.html - Windows:
%AppData%/LineVis/Logfile.html(i.e.,C:/Users/<USER>/AppData/Roaming/LineVis/Logfile.html) - macOS:
~/Library/Preferences/LineVis/Logfile.html