PAHDecomp (Donnan et al. 2022a) is a tool for modelling mid-infrared spectra of galaxies based on the popular PAHFIT code Smith et al. 2007. Unlike PAHFIT this model decomposes the continuum into a star-forming component and an obscured nuclear component based on Bayesian priors on the shape of the star-forming component (using templates + prior on extinction). This makes this tool ideally suited for modelling the spectra of heavily obscured galaxies. This is currently set up to run on the short low modules of Spitzer IRS data (5.2 - 14.2 microns) but will be ideal for JWST/MIRI MRS data in the future. I will update this page soon with the PAH profiles featured in Donnan et al. 2022b used for JWST/MIRI MRS spectra.
The fit is achieved using MCMC sampling from NUMPYRO. Specifically we use the NUTS sampler which is a Hamiltonian Monte Carlo allowing parallelisation to speed up computation time. This can even by ran on GPUs or TPUs.
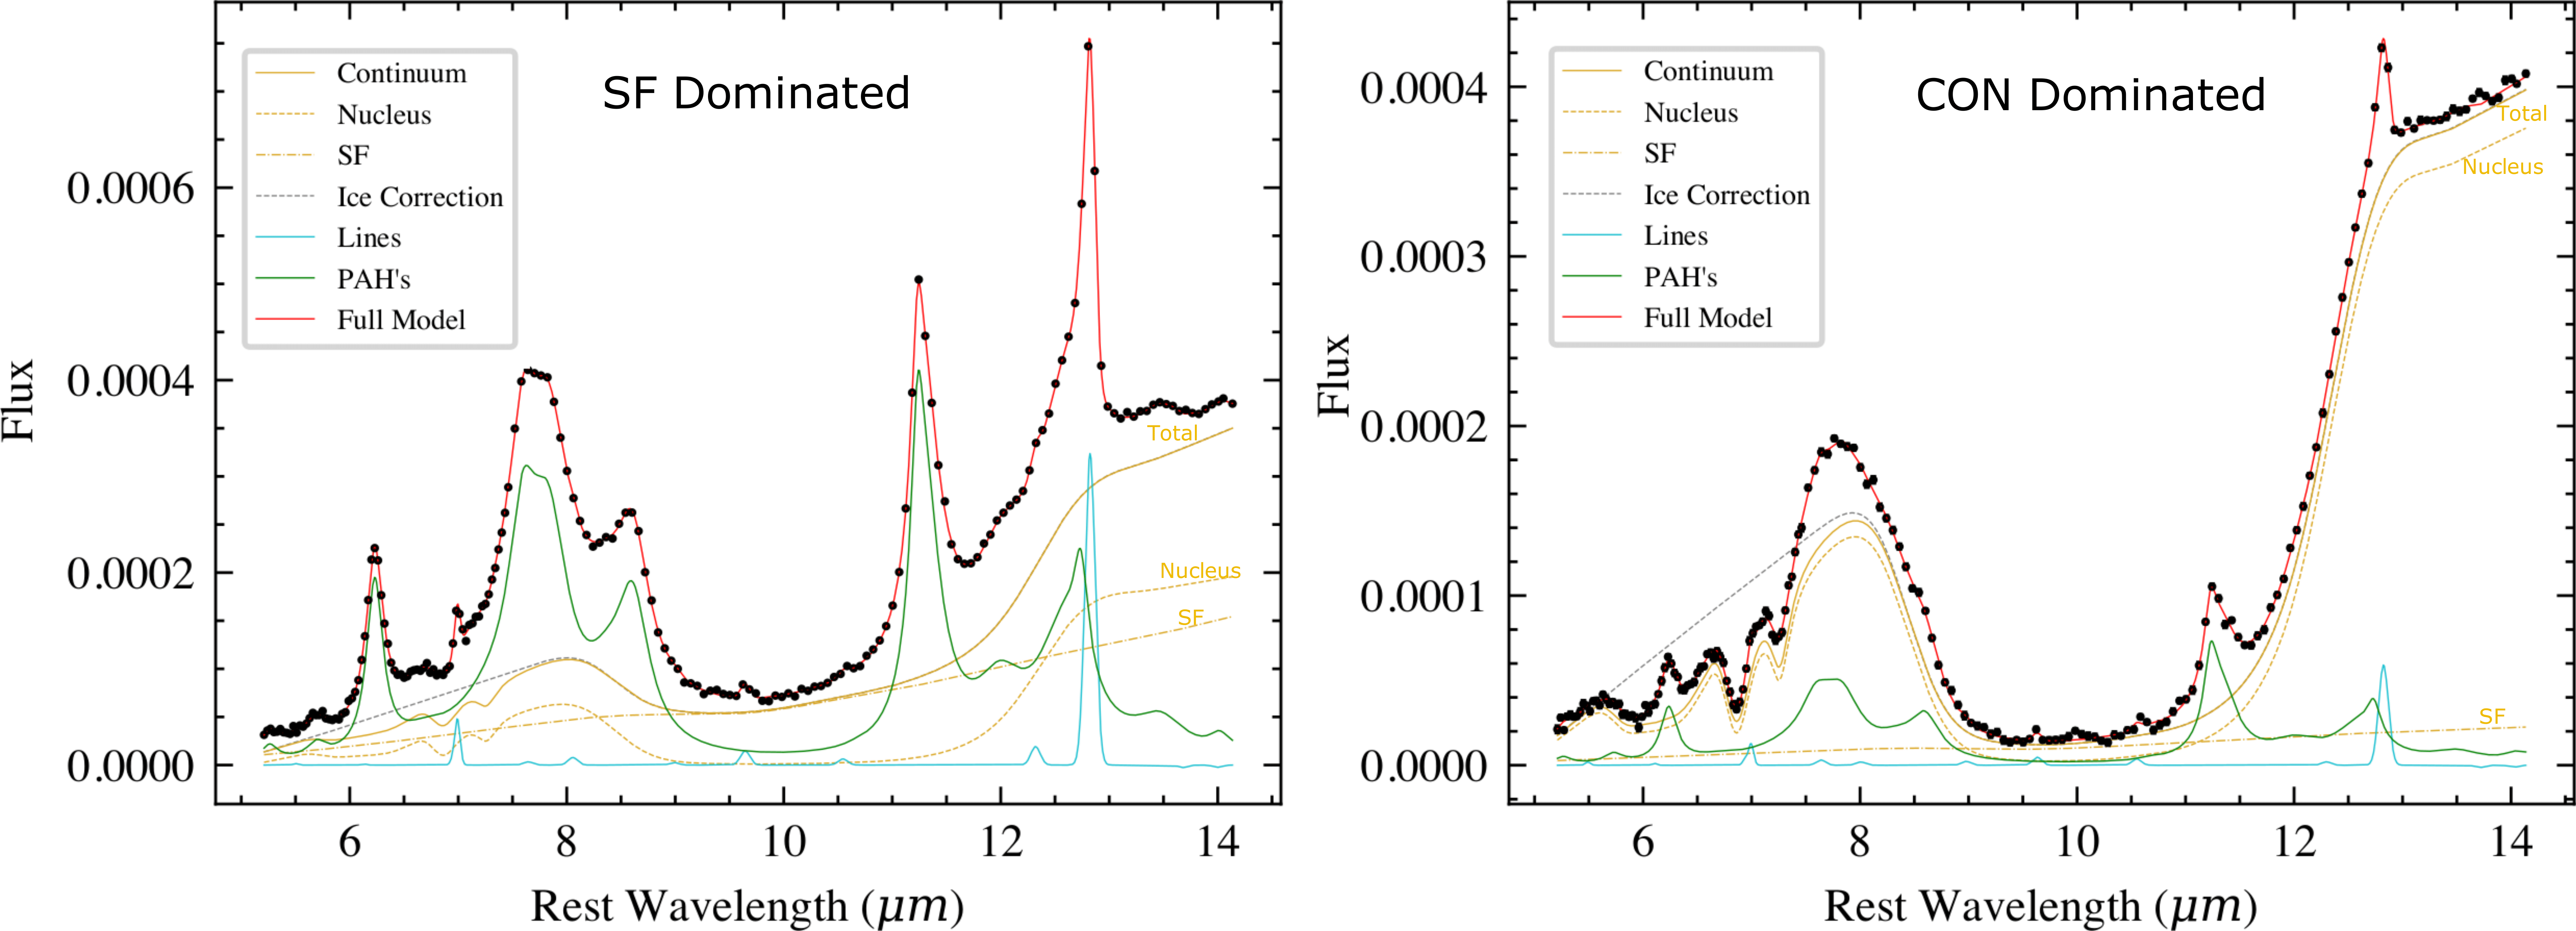
An example fit is shown below to mock data where the left panel shows a galaxy hosting a CON that is heavily diluted by relatively unobscured star-formaton in the galaxy disk compare to the right panel where the spectrum is dominated by the obscured nucleus.

To install simply download the files in the repository and place in some folder. To install any packages required for the code to work, from the terminal enter the directory and run: pip install -r requirements.txt
This code can be ran in two ways. Either by simply modelling a single spectrum of a galaxy or modelling multiple spectra simultaneously, extracted from different sized apertures centered on a given nucleus where the nuclear component is shared by each spectrum.
To specify the spectrum to fit, within PAHDecomp.py towards the bottom of the file enter the object name to the 'objs' array and its assoiciated redshift. For example to fit to 'Arp 200.txt' within the 'Data' folder set: objs=['Arp 220'] zs = [0.0] where zs specifies the redshift, in this case the spectrum is already rest frame. Multiple objects can be added to the list to run the fit on each one sequentially. To run the code type python 'PAHDecomp.py' in the terminal.
To run the model with a different extinction law for the star-forming component add the file to the 'Extinction Curves' folder and at the top of 'SetupFit.py' make sure the file is read in. Similarly to change the silicate profile for the nuclear component, add the file to the 'Nuclear Templates' folder and make sure it is read in in the 'SetupFit.py' file. The ice/CH templates can also be changed in the 'Ice Templates' folder.
The decomposition is influenced by two main priors, the extinction of the star-forming component being realtively low and the ratio of the star-forming continuum to the total PAH flux (i.e tying the strength of the star-forming continuum to the strength of the PAHs). These can be changed in the code.
To change the star-forming extinction prior, edit line 172 of SetupFit.py where currently a Truncated Normal prior is specified with [Lower Lim, Upper Lim, Mean, Std] = [0.0, 50.0, 0.0, 1.1].
To change the prior on the ratio of the PAH flux to star-forming continuum, edit line 153 of PAHDecomp.py where currently a normal prior is set with a mean = 1.92, Std = 10 (We used a wide prior in (Donnan et al. 2022a) and a tighter one in Donnan et al. 2022b). To more strongly tie the star-forming continuum to the PAH flux reduce the Std to 0.56 which is what we found for the HC+20 star-forming sample (I wouldn't recommend changing the mean).
The output from the fit will be written to the 'Results' directory which will contain
- A plot of the fit
- .txt files containing the constituent parts of the model
- NuclearParameters.csv contains the parameters defining the shape of the nuclear component such as the nuclear optical depth
- Output.csv contains the measured strengths and equivalent widths of the emission features. The strengths displayed for each of the line and PAH features are corrected by the extinction on the star-forming component. The PAH flux ratios given towards the end of the .csv file are the observed flux ratios and are not corrected by extinction.
If you use this code please cite (Donnan et al. 2022a):
@ARTICLE{2022arXiv221109628D, author = {{Donnan}, F.~R. and {Rigopoulou}, D. and {Garc{'\i}a-Bernete}, I. and {Pereira-Santaella}, M. and {Alonso-Herrero}, A. and {Roche}, P.~F. and {Aalto}, S. and {Hern{'a}n-Caballero}, A. and {Spoon}, H.~W.~W.}, title = "{A Detailed Look at the Most Obscured Galactic Nuclei in the Mid-Infrared}", journal = {arXiv e-prints}, keywords = {Astrophysics - Astrophysics of Galaxies}, year = 2022, month = nov, eid = {arXiv:2211.09628}, pages = {arXiv:2211.09628}, archivePrefix = {arXiv}, eprint = {2211.09628}, primaryClass = {astro-ph.GA}, adsurl = {https://ui.adsabs.harvard.edu/abs/2022arXiv221109628D}, adsnote = {Provided by the SAO/NASA Astrophysics Data System} }