GraphXML — is a simple XML-based language for describing charts with rendering in C + SDL2.
The idea is to create a lightweight and intuitive format, similar to Markdown, but for charts.
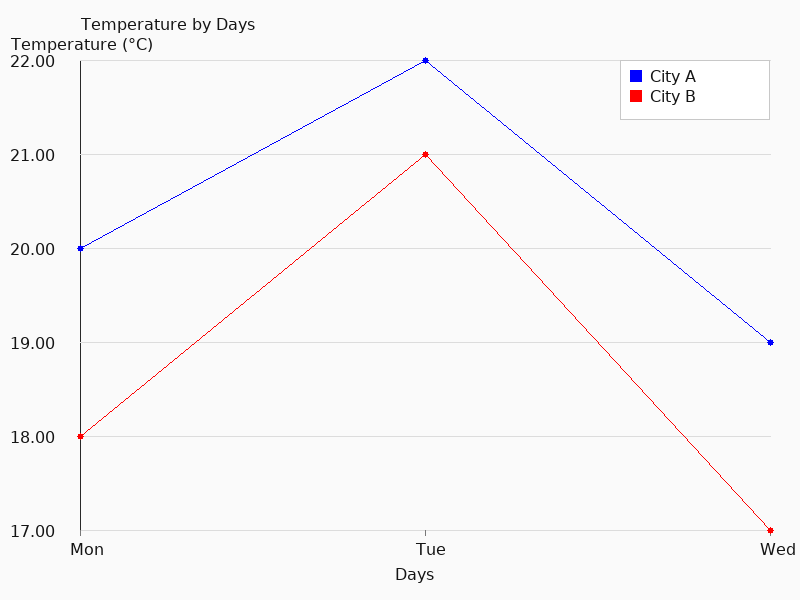
<dataset name="City A" color="blue">
    <point x="Mon" y="20"/>
    <point x="Tue" y="22"/>
    <point x="Wed" y="19"/>
</dataset>

<dataset name="City B" color="red">
    <point x="Mon" y="18"/>
    <point x="Tue" y="21"/>
    <point x="Wed" y="17"/>
</dataset>
Here is an example of a graph created from example.graphxml and saved as PNG without opening a window (headless mode):
