ROS-based project for automatically optimizing PID settings of a motorcontroller with genetic algorithms using the DEAP framework. Communication with motor controller is implemented via rosserial.
Please note:
PIDs can be tuned easier, faster and safer in software. This repo is for educational purposes only.
Pololu Baby Orangutan B-328 Robot Controller is used to drive a generic geared DC motor with a low-quality encoder (similar to this). Motor voltage is supplied by an external bench power supply at 7V. A USB-to-Serial bridge implements a communication interface to the main PC and supplies 5V.
The PID controller is translated into a genetic representation as a list object containing P-, I-, D- and several custom feed-forward control parameters. Using the DEAP framework, a population of individuals with randomly chosen parameters is created.
The fitness of each individual is determined by the function evaluate_individual. After publishing the individuals PID parameters via the ROS network as a custom message, it triggers a physical test run using a ROS service. The test_run_server.py offers three waveform generators that may be used to generate many different trajectories. By default, a squarewave is generated to evaluate a step response. It is continuously broadcast to the ROS network as setSpeed. A ROS serial node sends the message via UART to the controller. The controller reads the input signal, actuates the motor and evaluates the encoder feedback. It returns the calculated encoderSpeed to the ROS serial node that publishes it to the network. The ROS graph is shown below (service not shown):

The function evaluate_individual reads setSpeed and encoderSpeed from the ROS network and calculates the mean squared error over the duration of a test run to determine the fitness of the individual. Once the test run is completed, known-good PID parameters are send to the controller so the motor can stabilize before the next test run.
A sequence diagram of the evaluate_individual function is shown below:
sequenceDiagram
    participant Brain
    participant Test Run Server
    participant ROS Serial Node
    participant Controller
    participant Motor

    Note over Brain: New PID parameters are broadcast
    ROS Serial Node ->> Controller: New PID parameters
    Brain ->> Test Run Server: Trigger test run
    loop for each step in trajectory
        Note over Test Run Server: setSpeed is broadcast
        ROS Serial Node ->> Controller: setSpeed
        loop Independent control loop
            Controller ->>Motor: PWM signal
            Motor ->> Controller: Encoder signals
        end
        Controller ->> ROS Serial Node: encoderSpeed
        Note over ROS Serial Node: encoderSpeed is broadcast
    end
    Test Run Server ->> Brain: Test run done
    Note over Brain: Old PID parameters are broadcast
    ROS Serial Node ->> Controller: Old PID parameters
After each individual has a fitness value attached, a new generation is created using mutation and cross-over. The new generation is again evaluated until a fitness threshold is passed or until a predefined number of generations is reached.
git clone git@github.com:Finn2708/MLMC.git
cd MLMC/catkin_ws
catkin_make clean
catkin_make install
source devel/setup.bash
cd MLMC/PIO/lib
rosrun rosserial_arduino make_libraries . mlmc_msgs
To launch the entire project, run:
cd catkin_ws
source devel/setup.bash
roscore
roslaunch mlmc mlmc.launch
Training will start immediately with params defined in brain.py. A preconfigured rqt_plot window will show current and set speeds of the motor.
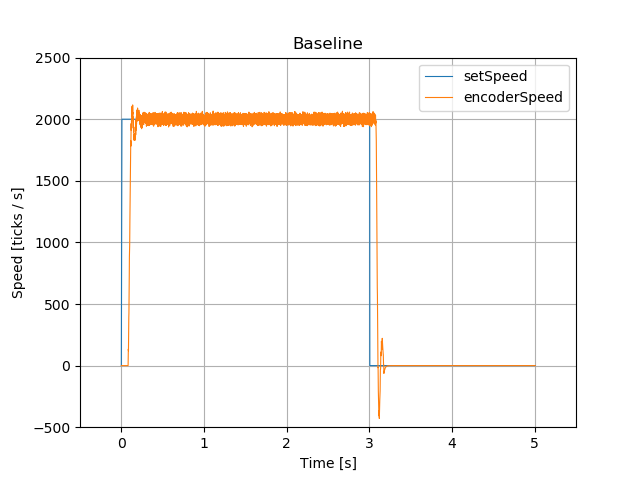
The following image shows the controller in a manually tuned state. It serves as a baseline reading to compare the genetically optimized controllers against. The diagram shows clear overshoot, but encoderSpeed is fairly precise and stable once setSpeed is reached
The parameter of the baseline controller are:
- P = 0.1
- I = 5.0
- D = 0.0
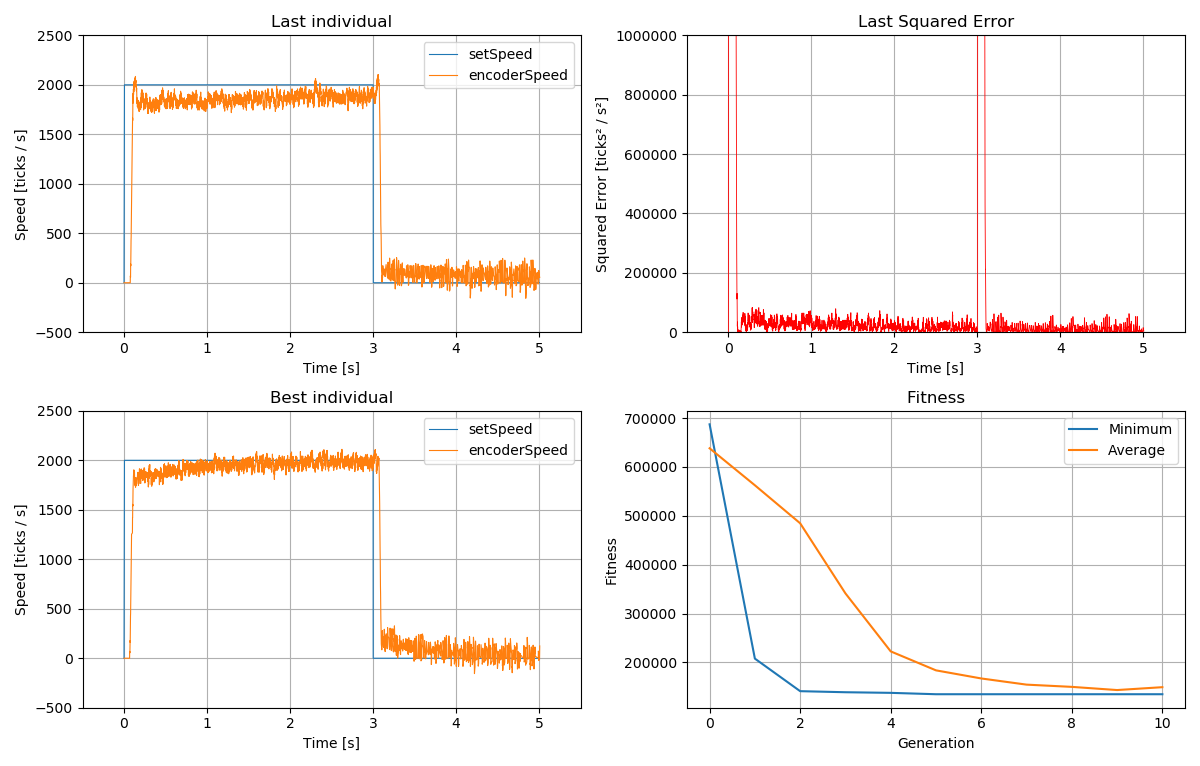
The diagram below shows results for a mean squared error fitness function (lower is better). A population size of 100 was chosen and the algorithm ran for 10 generations. After only two generations, an individual close to the all-time champion was found. After 9 generations, the average result stops improving.
Best individual is:
- P = 4.721105261913877
- I = 3.9555457895369717
- D = 0.04280607386434654
Overall, it is evident that mean squared error (MSE) is not ideal to tune the controller because of the high frequency noise induced.
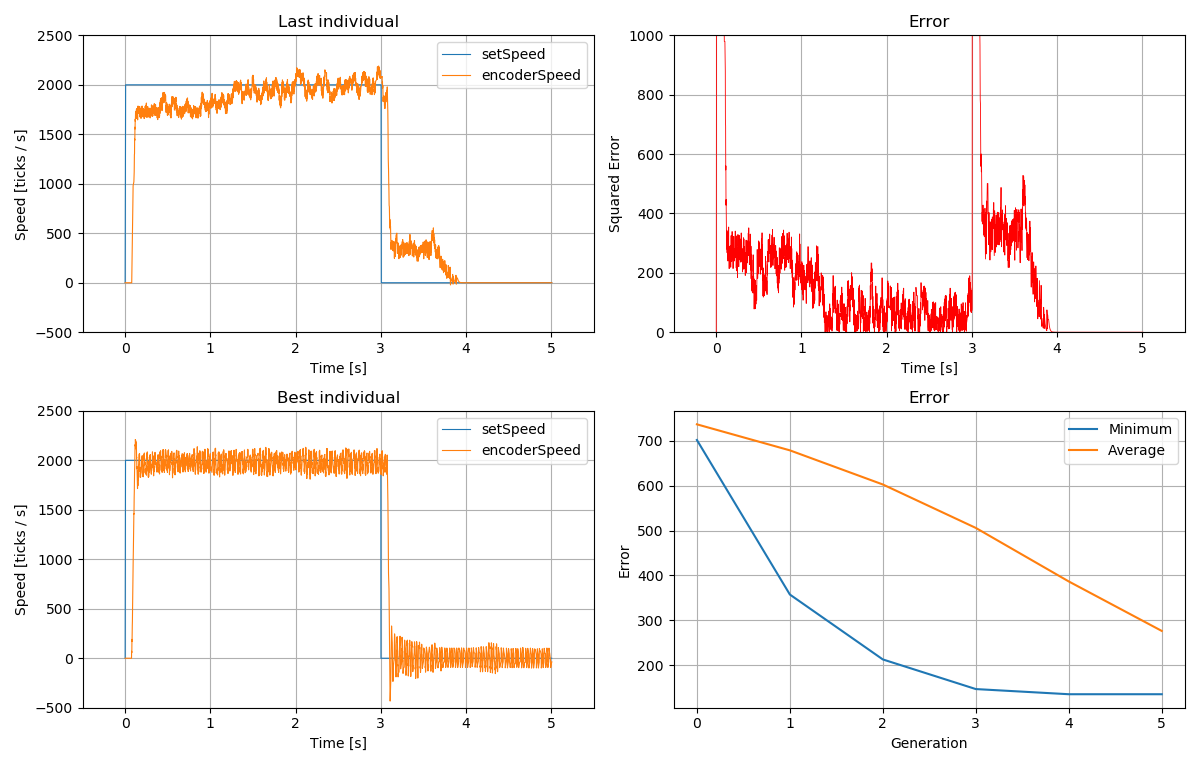
The diagram below shows the result with an evaluation function that sums up the absolute error.
PID parameters:
- P = 0.8878890486736224
- I = 7.911091579073943
- D = 0.0
The project can be improved upon by:
- Finding an evaluation function that takes high frequencies into account more
- Multi-Objective Optimization of, e.g., total error sum, step response and highest frequency


