enfolding was created for people searching for new ways to visualize absolute and relational spaces. We hope this software will assist users as they conduct exploratory visual analysis and tailor new visualizations of space. If you are not an avid mapper within traditional GIS environments or do not consider yourself a spatial theorist, do not worry. This platform and tutorials have been designed for people with varying knowledge, interests, and skills. Bring your creativity and stay tuned for upcoming examples and tutorials.
If you want to jump right in, you can get started with the online version of enfolding
The following tutorials, first written by Lindsey Funke, will help you get up-and-running with enfolding and give you an idea of what's possible:

enfolding allows users to fold, bend, collage, reassemble, fragment, interweave, and reimagine maps and other images and render them in 2D and 3D visualizations. At its core is the desire to upset the rigid spatialities of traditional Geographic Information Systems (GIS), opening them to the broader realm of geographical imagination systems (gis). What does this mean for users? enfolding can be used to bind two distant places that share intimate economic, emotional, or extractive connections to create an intertwined visualization of these relations across space. Through the interface you can stretch or shrink surface distances or get inside the map with rotating 3D representations. The possibilities to reshape, drape, and create are numerous.
enfolding draws on a number of JavaScript libraries including p5.js, three.js, and the delaunator.
In what follows we present a short introduction to the interface. More tutorials and guides will be published over time.
enfolding has two canvases, the editing canvas and the rendering canvas. Once you add your maps or layers to the editing canvas, you may toggle back and forth between editing and rendering as you work. Let´s take a closer look at each of these canvases before getting started.
Edit mode is where you will begin your project. Here you will add your maps and begin creating a grid or adding nodes that will shape your map later. We will examine each of these functions in more detail later on in the guide.
In the rendering canvas, you will be able to view your creation in 2D or 3D, bind maps together, and export your project for use outside of Enfolding.
To get started with enfolding you will need at least one image. This may be a map, a satellite image, a layer exported from a mapping software, etc.
Enfolding accepts most image formats including .PNG, JPG, .GIF, .SVG, among others. Be sure to save your images, when possible, with a transparent background if there is any white space around them.
To take full advantage of the transparency options in rendering mode, we like to work with SVGs. (Extra tip: you can export your QGIS projects as SVGs. Be sure to select a transparent background. Open them in Inkscape, a free and open source program for vector editing to make any final changes or remove unwanted layers.)
In order to add your image to the canvas, simply drag and drop. You may add up to two images to the editing canvas. The first image you add will be denominated “MAP 1” and the second “MAP 2”. This distinction will be important later on and determine the drawing order of the images. Try out working with a single image first in order to get a handle on the different options within enfolding.
You will notice two buttons at the top of the editing menu: “Focus” and “Reset”. As you are creating and adjusting your nodes and grids, these two buttons will be quite important.
- You must be focused on an image in order to add or remove nodes and grids. If you are working with two maps or layers, swap back and forth between the two by using the focus button.

- Click the reset button when you are ready to clear all the current nodes or grids from your images. If you would like to delete the current image, refresh the page to start with a blank canvas.
In order to fold, bend or crinkle your map, you will need to add a grid or individual nodes to the image.
You can add a basic grid by simply selecting its dimensions and clicking add grid. This will generate a new grid on the map in focus. You can tweak this grid later on by adjusting edge distance, creating new nodes, etc.

In order to bind your maps later, you will need the same number of nodes in each. For example, if you add a 3x5 grid in Map 1, you could choose a 5x3 grid in Map 2, or manually add 15 nodes.
Manually add nodes by double clicking the map of interest. By default, the node will make connection to the nearest 4 other nodes. If you would like adjust the number of connections made, simply use the drop-down menu in the advanced settings. The new node will automatically connect to number you selected.

You will notice that as you create nodes, text boxes that display node-node distances appear on each edge. You may adjust these distances in order to compress or pinch the map. Simply click the box, type a new number, and hit enter.
In order to change the distance between two particular nodes, click a single node. It will appear in red. Then select another node with a shared edge. The text box will appear and allow you to adjust the distance.
- To pinch the map, adjust to 0 and click enter. See an extended example here.
- In some particular cases, enfolding allows you to increase or exaggerate distances as well. Check out the wormhole demo for an example of this.

- Selecting the show triangles option will reveal the triangles created by your grid and node selection. For more information about Delaunay triangulation check out the delaunator’s guide.
- The show maps option allows you to hide or display your maps. All nodes and edges will remain visible.
- Check or uncheck the show inputs box if you would like to see or hide the distance text boxes as you create new nodes.
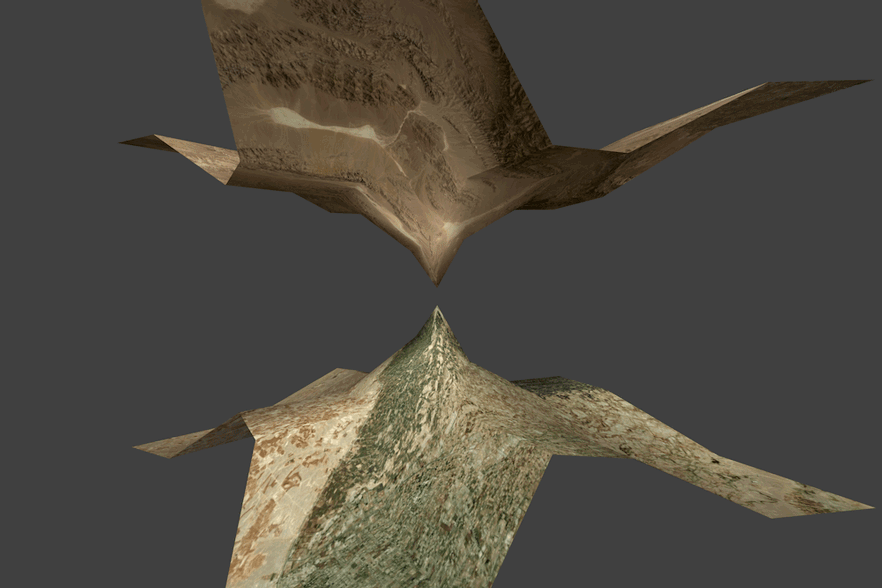
Once you have added a grid or drawn a few nodes, switch over to the rendering canvas to see how your maps are shaping up. You can always return to make any necessary adjustments.
- Your map will automatically render in 3D. Uncheck the box next to 3D in order to view your maps in two dimensions.
- If you choose to work with 2 images, check the box next to “Two map mode” to activate other features. Here you may bind the two images together, connecting them by 1-6 nodes. Remember, each image must contain the same number of nodes to bind together successfully.
- Activate the rotation feature below.
-
Once you have added a map or maps, you will be able to adjust their transparency using the associated sliders. We have found that this works best with SVGs.
-
Click any of the colored boxes to adjust the background color of the canvas.
- If you have a VR headset, get inside your map by checking the box.
-
Reveal the wire framework that sculpts your final map.


We are still developing a number of export options. For now, we have a few recommendations on how to export your enfolded map.
- Use the SAVE IMAGE button in the rendering canvas to export a .jpg of your canvas.
- Some operating systems automatically offer users the chance to capture a video of your screen. If your do not, many free options exist to do so.
-
If you would like to continue creating within a 3D graphics program like Blender, save your project as an OBJ.

enfolding (c) Luke Bergmann and Nick Lally