| Table of Contents |
|---|
| Overview |
| Technologies |
| Technical Challenges |
| API |
| Features |
| Upcoming Features |
| Code Implementation |
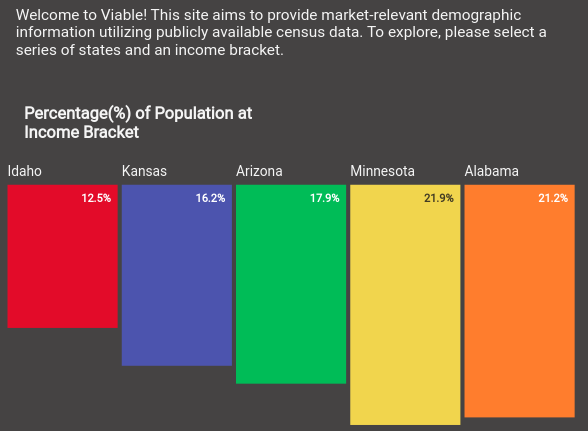
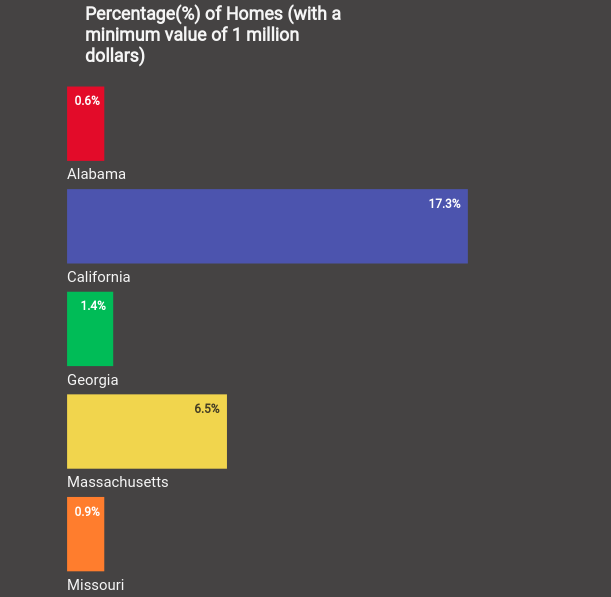
Viable is a market research tool that visually displays regional data that determine whether the area is favorable to creating new businesses, or expanding an existing franchise. For the current demo, the site is focusing on the luxury real estate environment, compared by state or territory.
D3 is a data visualization library, made for working with basic JavaScript, CSS and HTML elements. It also works with SVG. Proper use of D3 allows even static webpages to responsively display data based on user input, and its style of implementation makes it relativel simple to create many forms of graphs and data representation.
Utilizing US Census API's proved to be somewhat tricky. While locating the API's that contained market relevant information were relatively simple, accessing the necessary data could at times prove problematic. In some cases, certain states didn't have proper information on a given subject. In other cases, such as when accessing the American Community Survey 1-Year Data api, the number of potential variables that could be used to request data exceed the tens of thousands. Locating and then entering the proper variables in a meaningful order for querying the API was time consuming.
-
Single-page static application that still remains responsive to user input via D3.js and DOM fetching
-
Obtains region specific data via API call from the US Census API (Dependent on current and usable data from the US Census Bureau)
-
Filters data by Percentage of Population for a given Income Bracket
- Graphs displaying Computer/Internet use by Household
- Graphs displaying Population distribution by Age
- Map displaying statistics by region
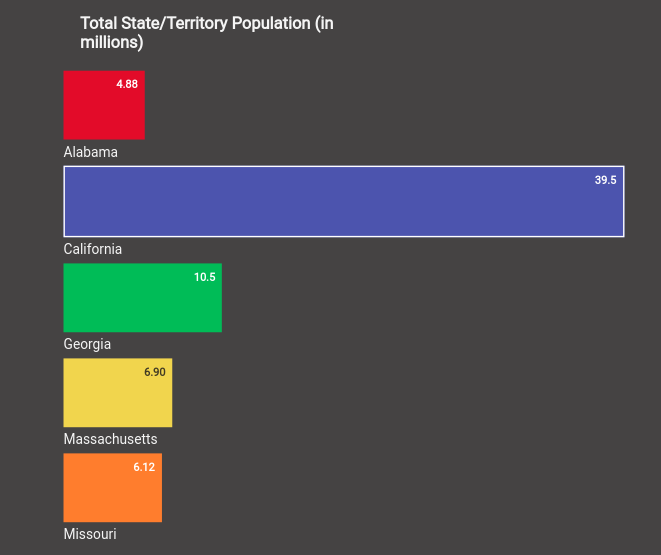
There were cases when utilizing the ACS (American Community Survey 1-Year Data) api that the call to the database returned raw numbers reaching into the millions. Adjusting this data for easy parsing by our users was done with the following code:
// STATE POPULATION

const fetchTotalPop = (stateCode, graph) => {

  fetchStatePop(stateCode).then(data =>{
    data.shift();

    let state = data[0]
    let name = [state[0]]
    let population = [state[1]]
    // popAnnotate : (population / 1000000).toString().slice(0, 3)

    d3.select(graph)
      .selectAll("div")
      .remove("div");

    d3.select(graph)
      .selectAll("p")
      .remove("p");

    d3.select(graph)
      .selectAll("div")
      .data(population)
      .enter()
      .append("div")
      .transition()
      .delay(1000)
      .style("width", function (population) { return population/50000 + 'px' })
      .text(function (population) { return (population / 1000000).toString().slice(0, 4); })

// ...
Despite having the ability to respond to user selections for different data requests, Viable is a single static page implementation of Vanilla DOM JS. The function below is an example of the conditionals created to prevent improper fetching to the API in the case where users didn't specify their preferred income bracket.
const stateASelect = () =>{
 let stateACode = stateA.options[stateA.selectedIndex].value

  if (stateACode!="default") {
    let bracketCode = incomeBracket.options[incomeBracket.selectedIndex].value;

    if (bracketCode != "defaultBracket"){

      fetchIncomePercent(bracketCode, stateACode, "#Graph-Display1");
      fetchTotalPop(stateACode, "#Graph-Display1Pop");
      fetchMillion(stateACode, "#Graph-Display1Million");

    }else{
      d3.select("#Graph-Display1")
        .selectAll("div")
        .remove("div");
      d3.select("#Graph-Display1Pop")
        .selectAll("div")
        .remove("div");
      d3.select("#Graph-Display1Million")
        .selectAll("div")
        .remove("div");
Thank you for previewing Viable.


