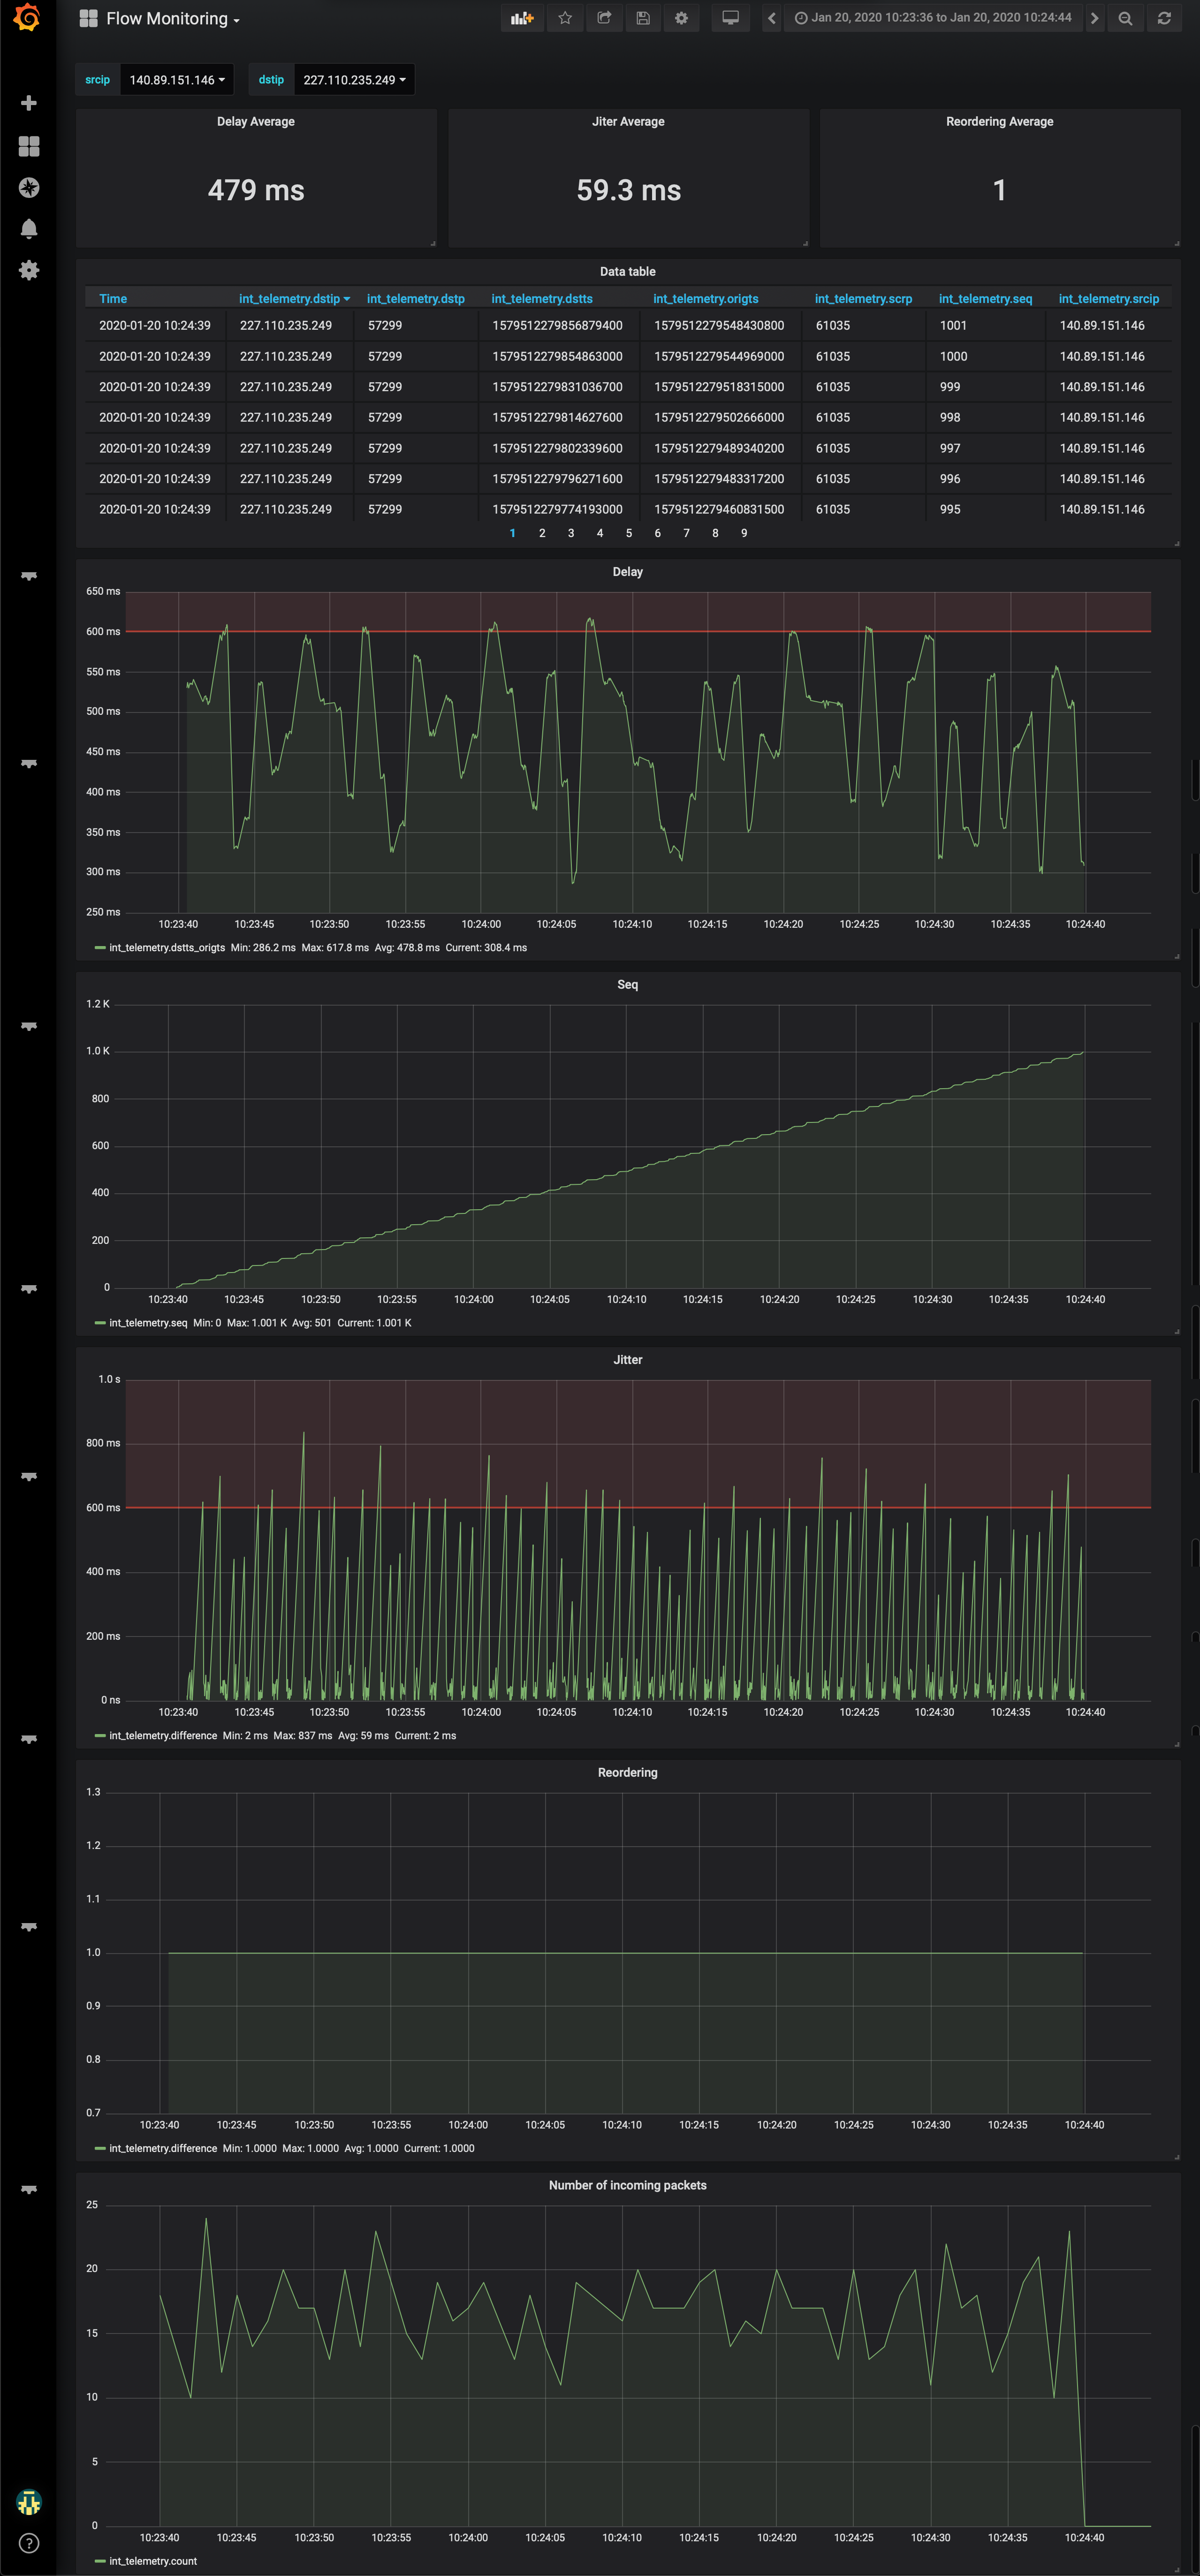
In-band Telemetry flow monitoring analytical platform is composed of the INT database (influxDB) and INT visualisation tooling (Grafana and Plotly-based).
The INT implementation and testing was done within the GÉANT Data Plane Programmibilty activity:
- InfluxDB: 1.8.3
- Grafana: 7.3.3
Increase available memory for influxdb UDP buffers:
sudo sysctl -w net.core.rmem_default=1073741824
sudo sysctl -w net.core.rmem_max=1073741824
Configure the same values permamently in `/etc/sysctl.conf'
net.core.rmem_max=1073741824
net.core.rmem_default=1073741824
Rename the file .env-example to .env. Then, change example values to valid passwords and usernames in .env file.
GF_SECURITY_ADMIN_USER=example_grafana_admin_user
GF_SECURITY_ADMIN_PASSWORD=example_grafana_admin_password
INFLUXDB_ADMIN_USER=example_influx_admin_user
INFLUXDB_ADMIN_PASSWORD=example_influx_admin_password
INFLUXDB_USER=example_influx_user
INFLUXDB_USER_PASSWORD=example_influx_user_password
To start INT monitoring stack for the first time create docker volumes manually and then start all defined services:
cd ./in_band_visualisation
sudo docker volume create influxdb-volume
sudo docker volume create grafana-volume
sudo docker-compose up -d
To stop the INT monitoring stack launch:
sudo docker-compose stopHost Container Service
3003 3000 grafana
8086 8086 influxdb
8089 8089 influxdb udp
5000 5000 plotly
- Using the wizard click on
Add data source - Choose a
namefor the source and flag it asDefault - Choose
InfluxDBastype - Choose
directasaccess - Fill remaining fields as follows and click on
Addwithout altering other fields
Url:    http://influxdb:8086
Database:   int_telemetry_db
- Use value of INFLUXDB_ADMIN_USER as a user and INFLUXDB_ADMIN_PASSWORD as password (please check Influx configuration in .env file)
Basic auth and credentials must be left unflagged. Proxy is not required.
Now you are ready to add your first dashboard and launch some query on database.
Select home > import dashboard > Upload .json File.
Select newest json file from ./grafana directory.
