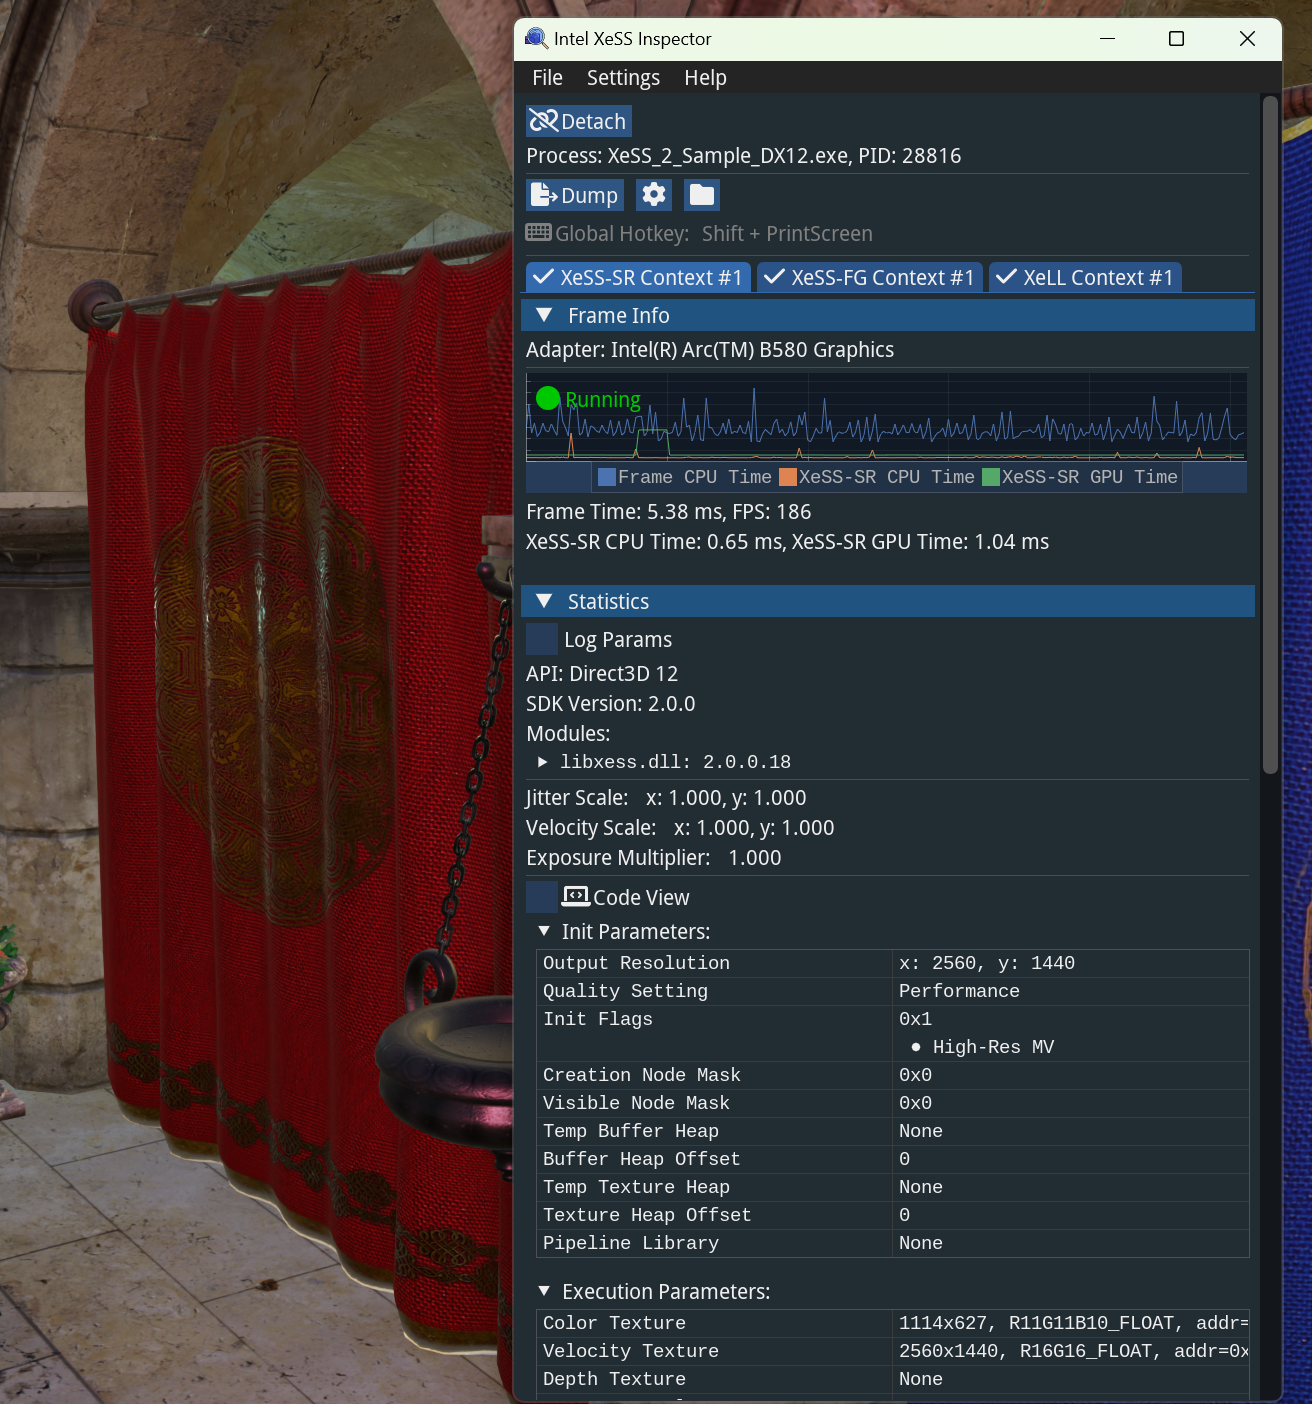
Intel® XeSS Inspector is a debugging and validation tool for Intel® Xe Super Sampling (XeSS). Its primary goal is to simplify the integration and debugging process for XeSS.
The Intel® XeSS Inspector provides a real-time display of XeSS state information, including all initialization and execution parameters. With GPU and CPU times measured and displayed in real-time, it enables developers to dynamically monitor the impact of XeSS on their application's performance.
With the frame dump feature, developers can facilitate the offline analysis and debugging of frames processed by XeSS, without any additional integration steps to enable dumping.
The HUD overlay feature allows for direct visualization of XeSS input buffers on the target application, supporting different views for various buffer types and enhancing the debugging process.
State overrides enable quick experimentations with different parameters, without any code modifications. Currently, the tool supports these experiments:
- Exposure scale
- Exposure multiplier* (Available from XeSS SDK 1.3)
- Jitter scale
- Velocity scale
- Quality level preset
- Initialization flags
The Intel® XeSS Inspector is a Windows x64 program that depends on DX12. It is compatible with all platforms that support Intel® XeSS. Please ensure that your target application is running in DX12 mode without anti-cheating or anti-debugging measures when using the XeSS Inspector.
For access to the latest features and fixes, download the most recent build from the Releases page.
The tool is designed to be intuitive. For quick start guidance and additional resources, please visit https://intel.com/xess-inspector.
