Alpha Vantage Examples and Scripts that I will use in YouTube videos. Feel free to check them out.
My YouTube to see the videos: https://www.youtube.com/channel/UCJHs6RO1CSM85e8jIMmCySw
I left an API key in all these scripts so they would run out of the box. You'll need to get your own API key which can be found here: https://www.alphavantage.co/support/#api-key
(Script provided by Alpha Vantage https://www.alphavantage.co/documentation/ )
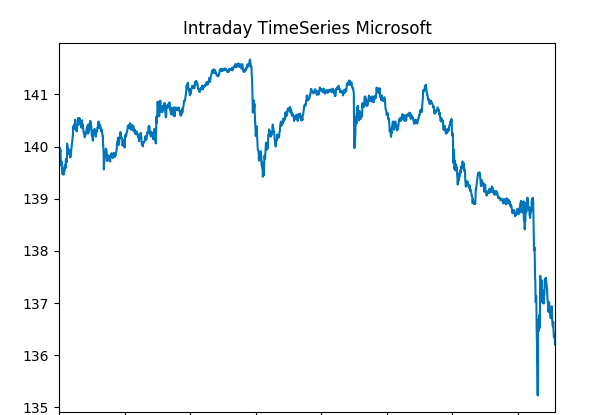
Returns data on the intraday timeseries of a stock specified by the symbol keyword arguement in the ts.get_intraday method.
Multiple output formats, pandas was selected in this script, close prices of each minute plotted with matplotlib https://github.com/Derrick-Sherrill/alpha-vantage-examples/blob/master/timeseries_example.py
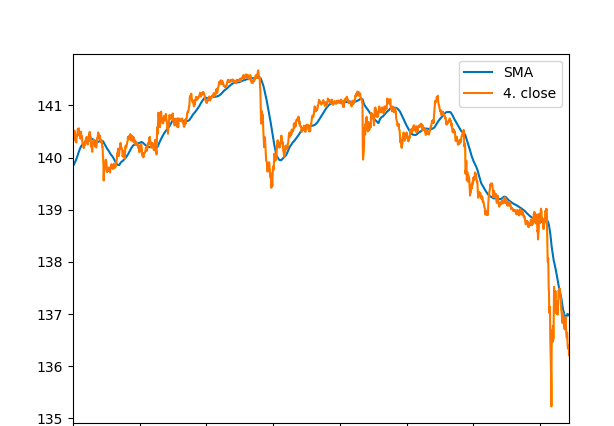
Combination of the technical indicators and time series API calls. Plotted against each other here:
Simple moving average here being calculated by last 60 minutes. Adjust for own purposes.
https://github.com/Derrick-Sherrill/alpha-vantage-examples/blob/master/sma_vs_close.py
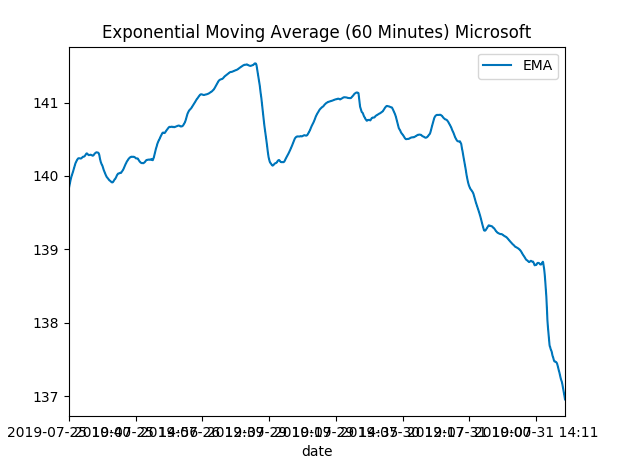
Calculating the EMA over each minute, using the last 60 minutes for the calculation.
https://github.com/Derrick-Sherrill/alpha-vantage-examples/blob/master/exponential_moving_average.py
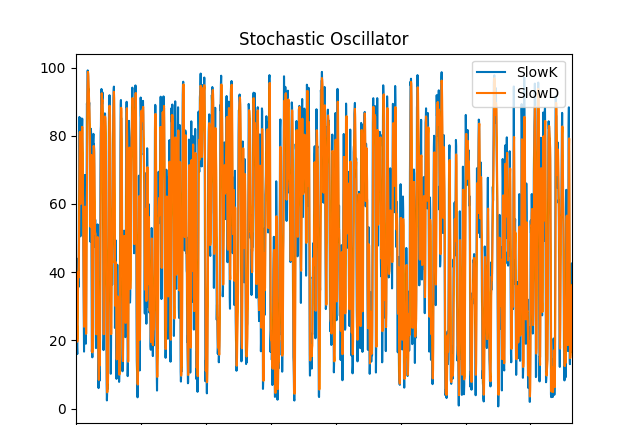
Please note the below script was used on a stock, not a security. Demonstration purposes only.
https://github.com/Derrick-Sherrill/alpha-vantage-examples/blob/master/stochastic_oscillator.py
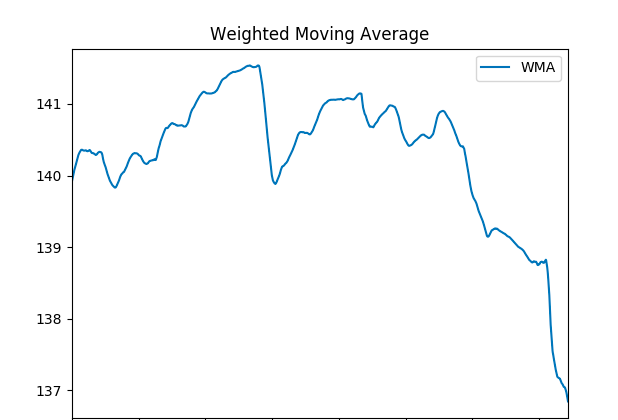
Weighted moving average of Microsoft:
https://github.com/Derrick-Sherrill/alpha-vantage-examples/blob/master/weighted_moving_average.py
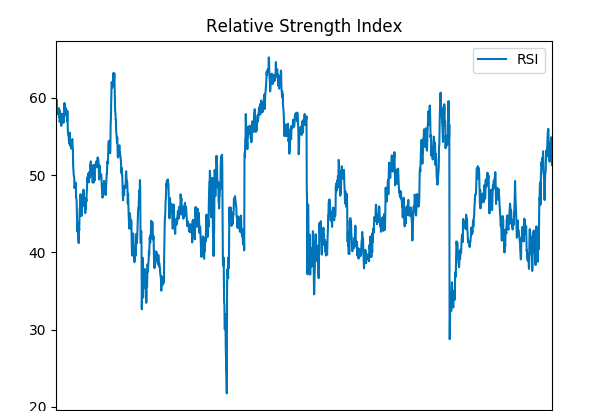
RSI is a momentum indicator that that measures the magnitude of recent price changes to evaluate overbought or oversold conditions in the price of a stock or other asset.
https://github.com/Derrick-Sherrill/alpha-vantage-examples/blob/master/relative_strength_index.py
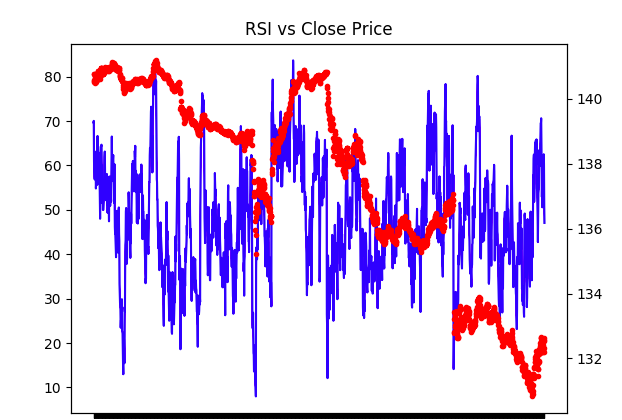
Plotting RSI against closing prices on the same graph, two y axis.
https://github.com/Derrick-Sherrill/alpha-vantage-examples/blob/master/rsi_vs_close.py
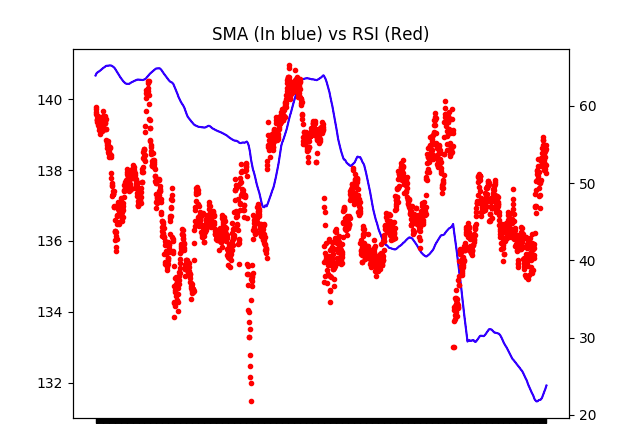
Plotting two technical indicators on the same graph using twinx() in matplotlib
https://github.com/Derrick-Sherrill/alpha-vantage-examples/blob/master/sma_and_rsi.py
https://www.alphavantage.co/documentation/ Chen, James. “Relative Strength Index – RSI.” Investopedia, Investopedia, 10 June 2019, www.investopedia.com/terms/r/rsi.asp.
