Heaptrack traces all memory allocations and annotates these events with stack traces. Dedicated analysis tools then allow you to interpret the heap memory profile to:
- find hotspots that need to be optimized to reduce the memory footprint of your application
- find memory leaks, i.e. locations that allocate memory which is never deallocated
- find allocation hotspots, i.e. code locations that trigger a lot of memory allocation calls
- find temporary allocations, which are allocations that are directly followed by their deallocation
The recommended way is to launch your application and start tracing from the beginning:
heaptrack <your application and its parameters>

heaptrack output will be written to "/tmp/heaptrack.APP.PID.gz"
starting application, this might take some time...

...

heaptrack stats:
    allocations:            65
    leaked allocations:     60
    temporary allocations:  1

Heaptrack finished! Now run the following to investigate the data:

    heaptrack --analyze "/tmp/heaptrack.APP.PID.gz"
Alternatively, you can attach to an already running process:
heaptrack --pid $(pidof <your application>)

heaptrack output will be written to "/tmp/heaptrack.APP.PID.gz"
injecting heaptrack into application via GDB, this might take some time...
injection finished

...

Heaptrack finished! Now run the following to investigate the data:

    heaptrack --analyze "/tmp/heaptrack.APP.PID.gz"
When you are trying to profile a system where you do not have direct access to debug symbols, which is commonly the case on embedded systems, the above steps won't give you useful data. There, you instead first need to record a raw trace file and then later interpret it on a system where you have access to an SDK or sysroot with the required debug symbols.
Record a raw trace file on the embedded system:
heaptrack --raw <your application and its parameters>
Then download the raw trace file to your development machine and interpret the data:
heaptrack --interpret "/path/heaptrack.test_c.8911.raw.zst" --sysroot "/path/to/sysroot"
Then, you can analyze it:
heaptrack --analyze "/tmp/heaptrack.test_c.8911.zst"
If you have other folders outside of the sysroot that contain debug information, you can pass them via --debug-paths
to heaptrack --interpret, see also: https://sourceware.org/gdb/current/onlinedocs/gdb.html/Separate-Debug-Files.html
Furthermore, if you have custom code side loaded and want to load the debug information from the respective build
folders, use --extra-paths, e.g.:
heaptrack --interpret "/path/heaptrack.test_c.8911.raw.zst" --sysroot "/path/to/sysroot"
Heaptrack is split into two parts: The data collector, i.e. heaptrack itself, and the
analyzer GUI called heaptrack_gui. The following summarizes the dependencies for these
two parts as they can be build independently. You will find corresponding development
packages on all major distributions for these dependencies.
On an embedded device or older Linux distribution, you will only want to build heaptrack.
The data can then be analyzed on a different machine with a more modern Linux distribution
that has access to the required GUI dependencies.
If you need help with building, deploying or using heaptrack, you can contact KDAB for commercial support: https://www.kdab.com/software-services/workshops/profiling-workshops/
Both parts require the following tools and libraries:
- cmake 2.8.9 or higher
- a C++11 enabled compiler like g++ or clang++
- zlib
- optionally: zstd for faster (de)compression
- elfutils
- libdl
- pthread
- libc
The heaptrack data collector and the simplistic heaptrack_print analyzer depend on the
following libraries:
- boost 1.41 or higher: iostreams, program_options
- libunwind
For runtime-attaching, you will need gdb installed.
At runtime, heaptrack will try to load these optional dependencies to demangle Rust & D symbols:
The graphical user interface to interpret and analyze the data collected by heaptrack depends on Qt 5 and some KDE libraries:
- extra-cmake-modules
- Qt 5.2 or higher: Core, Widgets
- KDE Frameworks 5: CoreAddons, I18n, ItemModels, ThreadWeaver, ConfigWidgets, KIO, IconThemes
When any of these dependencies is missing, heaptrack_gui will not be build.
Optionally, install the following dependencies to get additional features in
the GUI:
- KDiagram: KChart (for chart visualizations)
Run the following commands to compile heaptrack. Do pay attention to the output of the CMake command, as it will tell you about missing dependencies!
cd heaptrack # i.e. the source folder
mkdir build
cd build
cmake -DCMAKE_BUILD_TYPE=Release .. # look for messages about missing dependencies!
make -j$(nproc)
heaptrack_print and heaptrack_gui can be built on platforms other than Linux, using the dependencies mentioned above.
On macOS the dependencies can be installed easily using homebrew and the KDE homebrew tap.
brew install qt@5

# prepare tap
brew tap kde-mac/kde https://invent.kde.org/packaging/homebrew-kde.git
"$(brew --repo kde-mac/kde)/tools/do-caveats.sh"

# install dependencies
brew install kde-mac/kde/kf5-kcoreaddons kde-mac/kde/kf5-kitemmodels kde-mac/kde/kf5-kconfigwidgets \
             kde-mac/kde/kf5-kio kde-mac/kde/kdiagram \
             extra-cmake-modules ki18n threadweaver \
             boost zstd gettext

# run manual steps as printed by brew
ln -sfv "$(brew --prefix)/share/kf5" "$HOME/Library/Application Support"
ln -sfv "$(brew --prefix)/share/knotifications5" "$HOME/Library/Application Support"
ln -sfv "$(brew --prefix)/share/kservices5" "$HOME/Library/Application Support"
ln -sfv "$(brew --prefix)/share/kservicetypes5" "$HOME/Library/Application Support"
To compile make sure to use Qt from homebrew and to have gettext in the path:
cd heaptrack # i.e. the source folder
mkdir build
cd build
CMAKE_PREFIX_PATH=/opt/homebrew/opt/qt@5 PATH=$PATH:/opt/homebrew/opt/gettext/bin cmake ..
cmake -DCMAKE_BUILD_TYPE=Release .. # look for messages about missing dependencies!
make heaptrack_gui heaptrack_print
Heaptrack generates data files that are impossible to analyze for a human. Instead, you need
to use either heaptrack_print or heaptrack_gui to interpret the results.
The highly recommended way to analyze a heap profile is by using the heaptrack_gui tool.
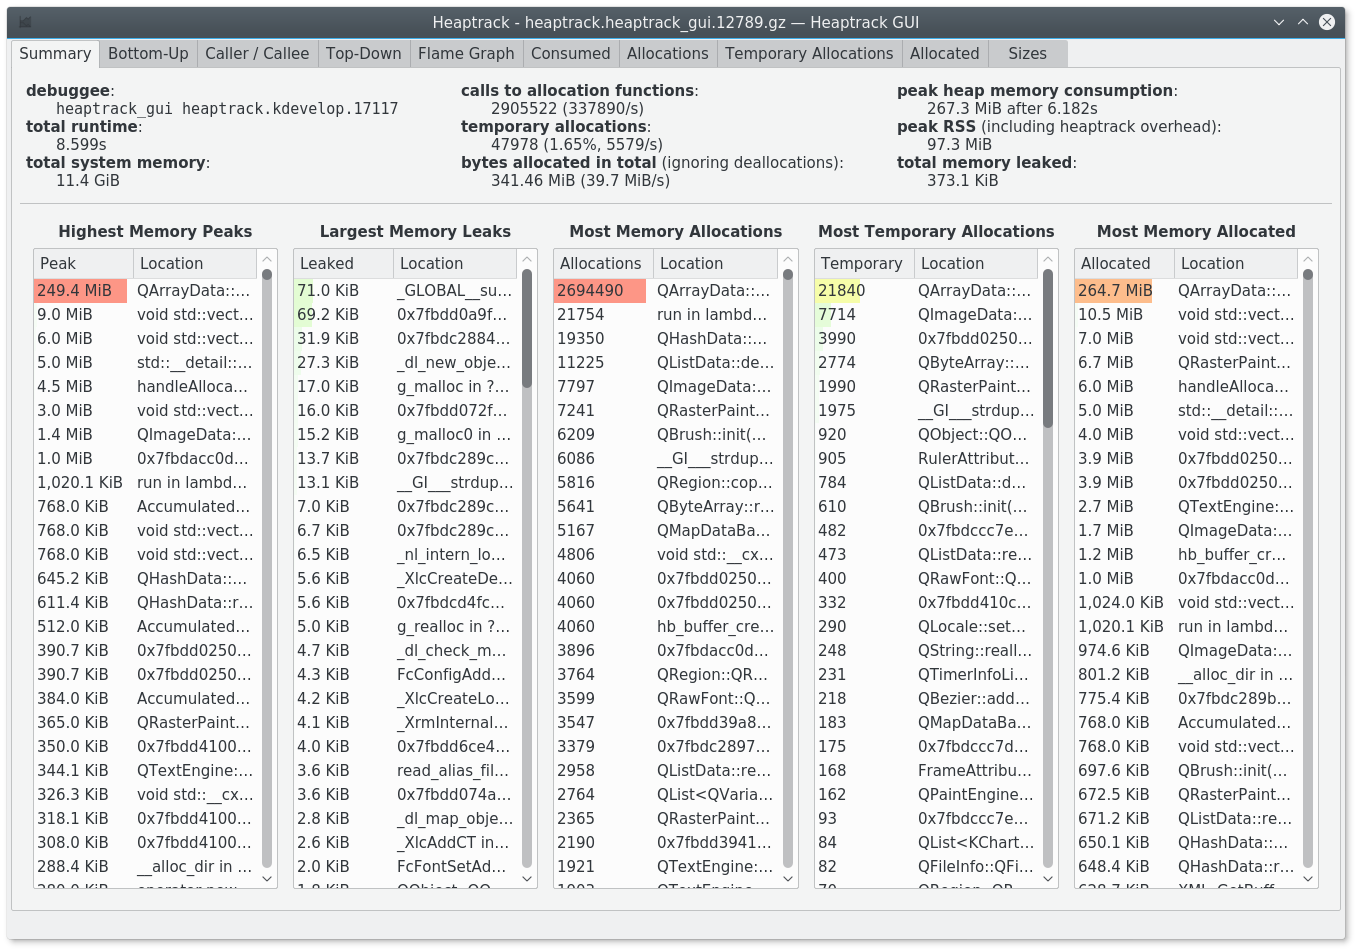
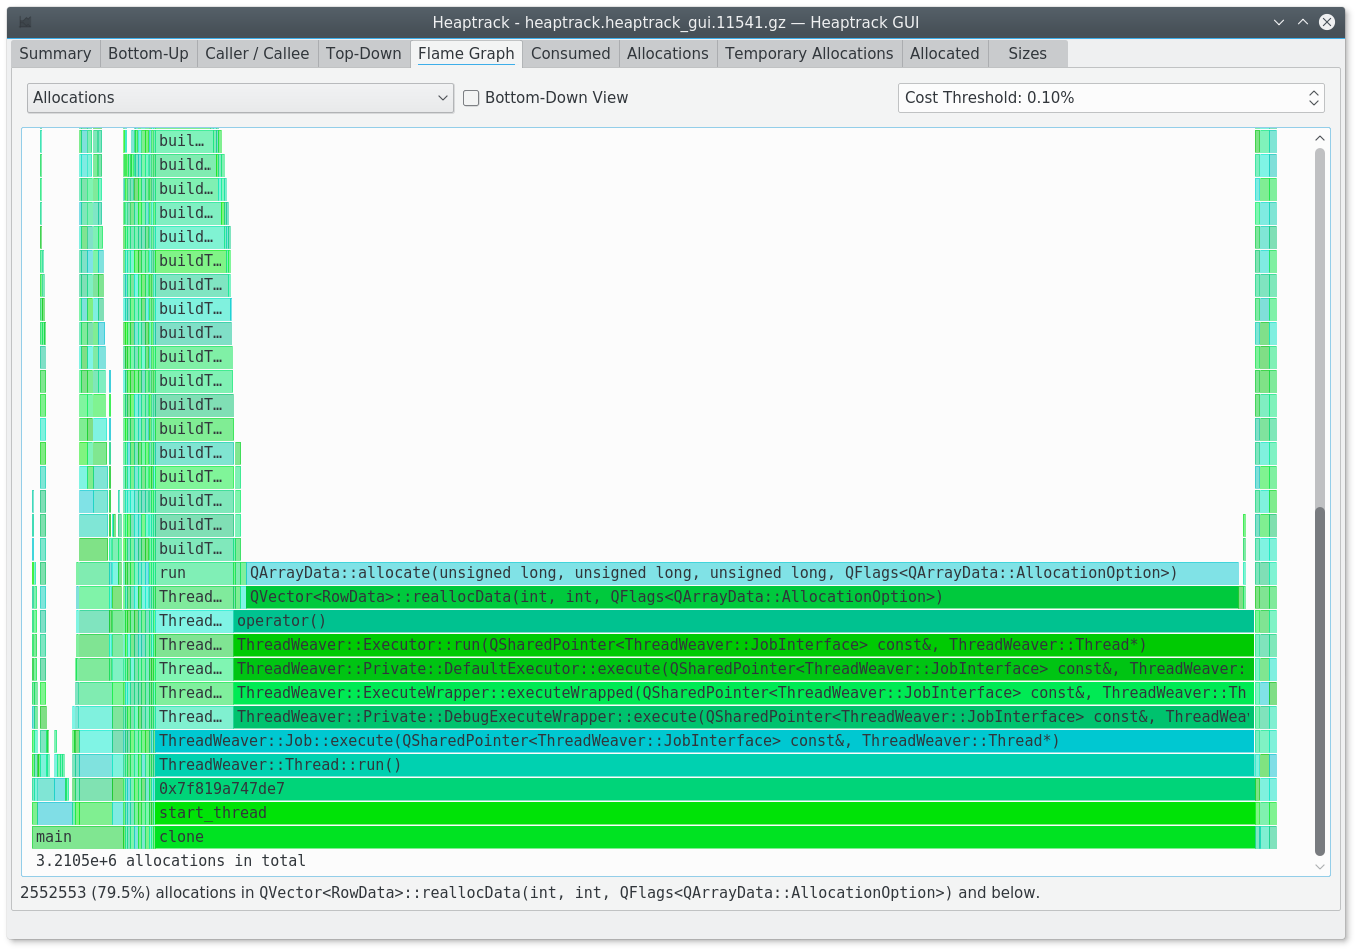
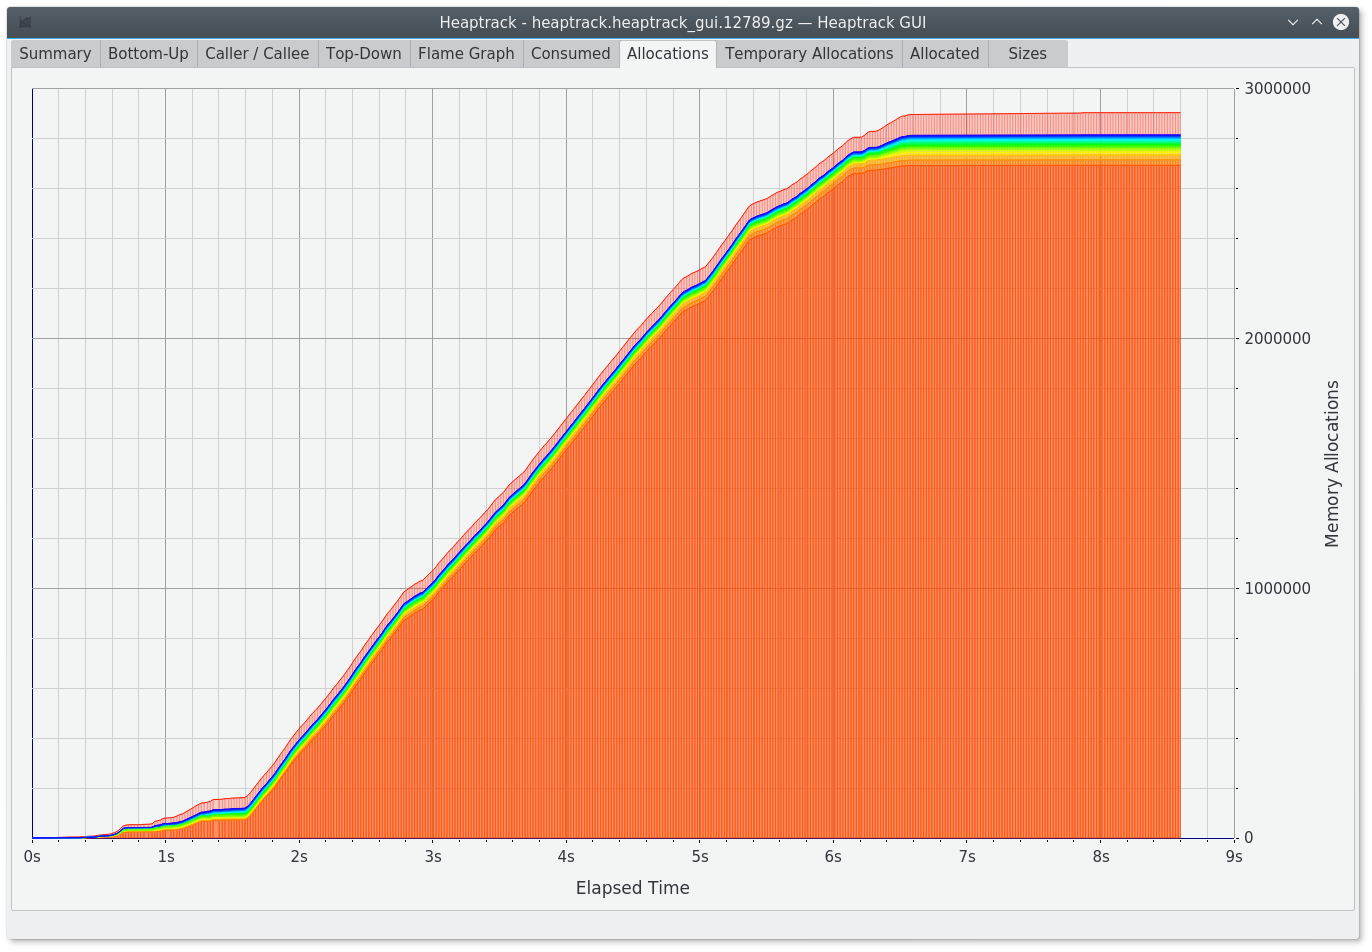
It depends on Qt 5 and KF 5 to graphically visualize the recorded data. It features:
- a summary page of the data
- bottom-up and top-down tree views of the code locations that allocated memory with their aggregated cost and stack traces
- flame graph visualization
- graphs of allocation costs over time
The heaptrack_print tool is a command line application with minimal dependencies. It takes
the heap profile, analyzes it, and prints the results in ASCII format to the command line.
In its most simple form, you can use it like this:
heaptrack_print heaptrack.APP.PID.gz | less
By default, the report will contain three sections:
MOST CALLS TO ALLOCATION FUNCTIONS
PEAK MEMORY CONSUMERS
MOST TEMPORARY ALLOCATIONS
Each section then lists the top ten hotspots, i.e. code locations that triggered e.g. the most memory allocations.
Have a look at heaptrack_print --help for changing the output format and other options.
Note that you can use this tool to convert a heaptrack data file to the Massif data format.
You can generate a collapsed stack report for consumption by flamegraph.pl.
The idea to build heaptrack was born out of the pain in working with Valgrind's massif. Valgrind comes with a huge overhead in both memory and time, which sometimes prevent you from running it on larger real-world applications. Most of what Valgrind does is not needed for a simple heap profiler.
-
speed and memory overhead
Multi-threaded applications are not serialized when you trace them with heaptrack and even for single-threaded applications the overhead in both time and memory is significantly lower. Most notably, you only pay a price when you allocate memory -- time-intensive CPU calculations are not slowed down at all, contrary to what happens in Valgrind.
-
more data
Valgrind's massif aggregates data before writing the report. This step loses a lot of useful information. Most notably, you are not longer able to find out how often memory was allocated, or where temporary allocations are triggered. Heaptrack does not aggregate the data until you interpret it, which allows for more useful insights into your allocation patterns.
-
ability to profile page allocations as heap
This allows you to heap-profile applications that use pool allocators that circumvent malloc & friends. Heaptrack can in principle also profile such applications, but it requires code changes to annotate the memory pool implementation.
-
ability to profile stack allocations
This is inherently impossible to implement efficiently in heaptrack as far as I know.
In general, Heaptrack mostly works with Rust binaries out of the box, as Rust programs include the corresponding debug symbols. Demangling is not yet supported, however most symbol names are still decipherable.
There are also a few other details to keep in mind.
If building in release mode, make sure debug symbols are enabled.
Add this to your Cargo.toml:
[profile.release]
debug = true
Running heaptrack cargo run will not work as intended, as this will profile Cargo's memory usage, not that of your application.
Instead either:
- Compile your binary as normal with
cargo build --releaseand run heaptrack on the resulting binary in thetarget/release/directory.- e.g.:
heaptrack ./target/release/my-rust-app
- e.g.:
- Install cargo-heaptrack (unofficial) and run
cargo heaptrack.⚠️ Make sure to run the analysis command as prompted by the command-line output before opening the GUI
In Heaptracks GUI under the Callee/Caller graph, you can double-click a location to open an editor there.
The file paths are relative, so make sure to open the heaptrack GUI at the root of your project, in order for this to work correctly.
As a FOSS project, we welcome contributions of any form. You can help improve the project by:
- submitting bug reports at https://bugs.kde.org/enter_bug.cgi?product=Heaptrack
- contributing patches via https://invent.kde.org/sdk/heaptrack
- translating the GUI with the help of https://l10n.kde.org/
- writing documentation on https://userbase.kde.org/Heaptrack
When submitting bug reports, you can anonymize your data with the tools/anonymize script:
tools/anonymize heaptrack.APP.PID.gz heaptrack.bug_report_data.gz
Libunwind may produce bogus backtraces when unwinding from code linked with old versions of the gold linker. In such cases, recording with heaptrack seems to work and produces data files. But parsing these data files with heaptrack_gui will often lead to out-of-memory crashes. Looking at the data with heaptrack_print, one will see garbage backtraces that are completely broken.
If you encounter such issues, try to relink your application and also libunwind with ld.bfd instead of ld.gold.
You can see if you are affected by running the libunwind unit tests via make check. But do note that you
need to relink your application too, not only libunwind.
If you run heaptrack on an application built with ASAN, you'll likely get this fatal error on startup:
ASan runtime does not come first in initial library list [...]
The solution is to pass the --asan flag to heaptrack.
Note: this only work for binaries built with gcc (i.e. those which link to libasan.so).
Binaries built with clang's ASAN enabled are not supported at the moment.


