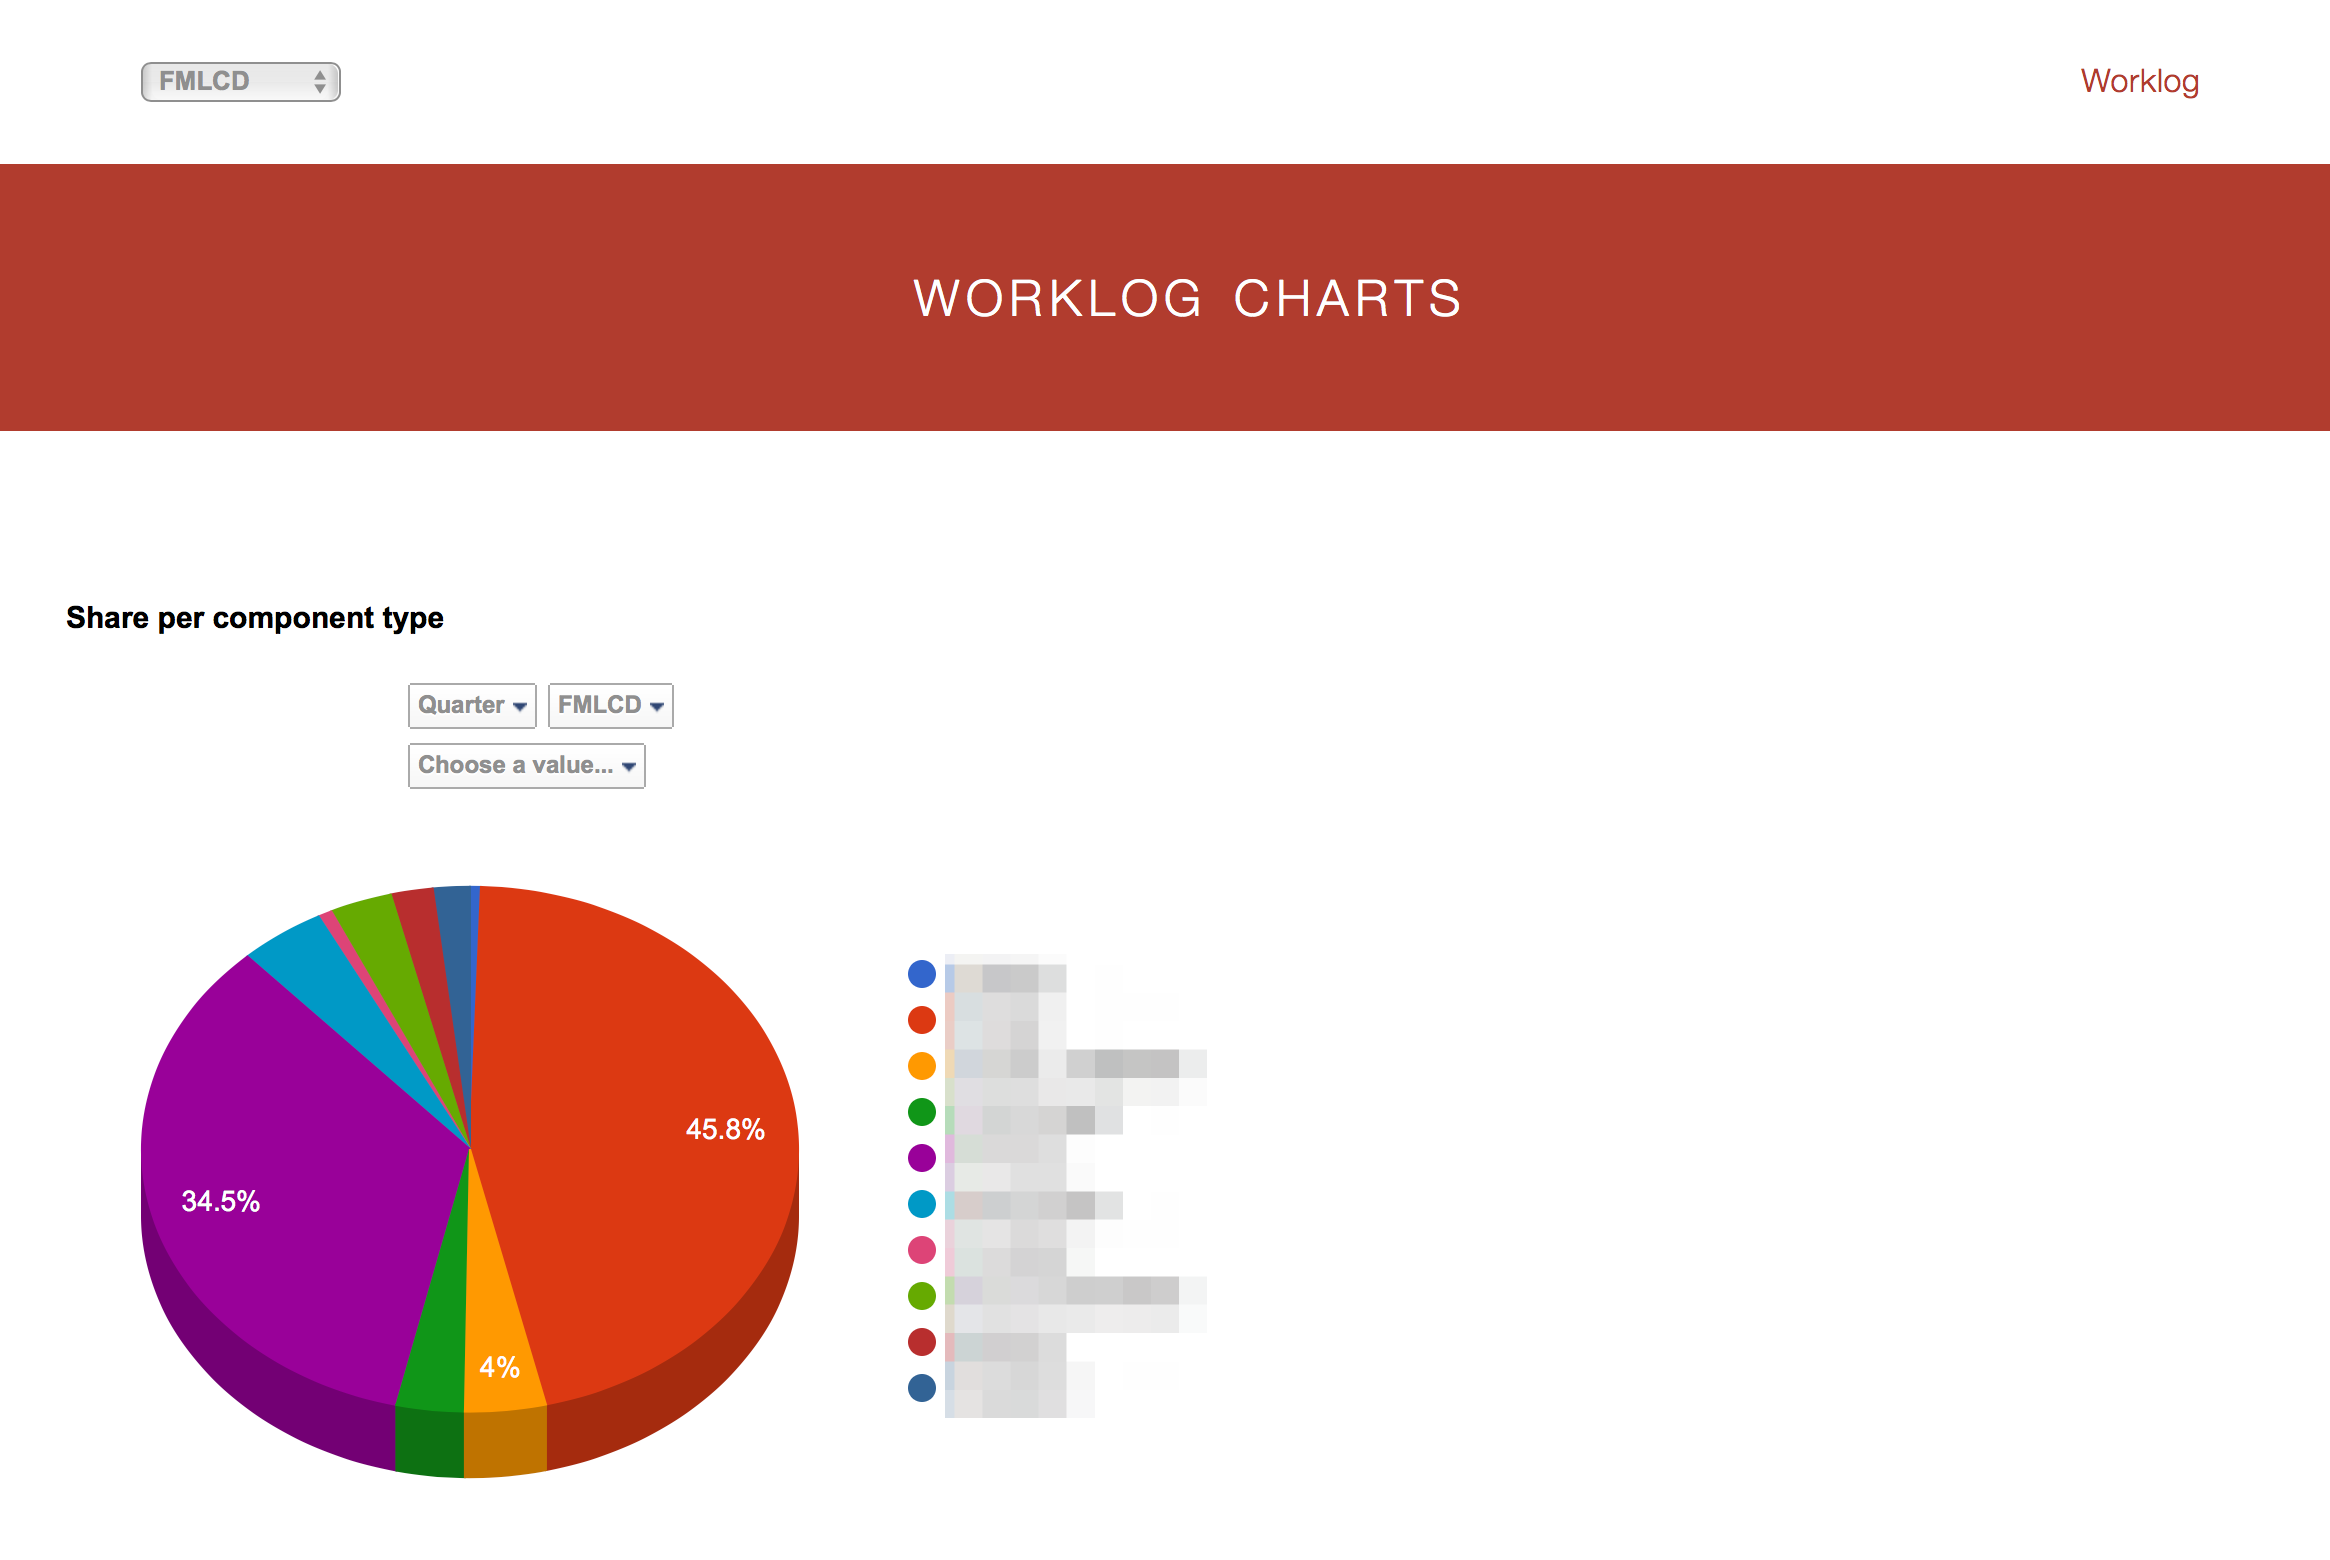
Simple Javascript UI to display relevant Jira statistics using Google Charts (https://developers.google.com/chart/)
The goal of the project is to provide graphical information around a private Jira repository through dashboard. Each dashboard can be drilled down to the Jira instance in order to get more detailed information. Each dashboard can display information on different timescales:
- sprints
- months
- quarters
Note that the goal is mainly to provide reports over the worklog logged into the tool in order to follow up on executions of group of tasks.
The project has been tested on Jira 7.x
A scheduled task is triggered every hour in order to fetch all the relevant information from Jira. It automatically refreshes the document representing Jira issues in Elastic Search. Search being way faster in Elastic Search than through Jira it allows the UI to query frenetically the local Elastic Search instance without impacting Jira, providing an almost real-time information.
- Worklog per component over a timeperiod
- Worklog per epics over a timeperiod
To be added:
- Average age for a bug
- Commited Points vs Done points
- Average fix time per complexity
- Spring Boot 2.0
- Spring MVC
- Spring Data Elastic Search
- Jackson
- Elastic Search
- Gradle
In order to configure the project, edit the following properties files:
- jira-webgraphs/src/main/ressources/application.properties:
- spring.data.jest.uri : the url for the elastic search instance
- spring.data.jest.maxindexsearch : max index search parameter for Elastic Search
- server.port : the port used by the embedded tomcat server
- jira-webgraphs/src/main/ressources/jira.properties:
- jira.baseurl : the url for the jira instance
- jira.project : acronyms for project to follow (separated by / ie PRJ1/PRJ2)
- jira.board : the associated name for a project board (used to retrieve information around sprints)
- jira.username : a jira username (my instance does not allow OAuth2)
- jira.password : the associated password (my instance does not allow OAuth2)
- jira.maximum : the maximum number of results obtained per Jira Rest queries (usually 1000)
- Gradle: https://gradle.org
- Elastic search (the easiest way before I provide a Docker compose file for everything would be to run one of the official docker images)
Once compiled, the produced war file is executable. Run it using: java -jar jira-webgraphs-{version}.war
You can connect to the UI through http://localhost:{serverPort} (by default http://localhost:8888)
