we aim to explore and compare the performance of different Convolutional Neural Network (CNN) architectures. We draw our motivation from the multi-class labelling problem posed by the Amazon rainforest dataset on Kaggle. The architectures considered are: 4 and 5 layer CNN models, VGG models, and ensemble models. We also discuss in detail the issues faced when scaling from binary classification tasks to multilabel classification tasks.
The full dataset consists of 40,478 satellite images. The images are 256x256 pixels with 4 channels (RGB and infrared) and each image covers 90 hectares of land. There are 17 labels that each image can be classified by. These fall into 3 broad categories: Weather conditions, common cover/activity and rare cover/land use. Weather conditions include: clear, partly cloudy, cloudy, and haze. The common cover/land use labels are: primary rainforest, Water (rivers and lakes), Habitation, agriculture, road, cultivation and bare ground. The rare cover/land use labels include slash and burn agriculture, selective logging, blooming, conventional mining, and artisanal mining.
The frequency of the 17 labels is also quite varied; with the primary label denoting forest forming 90% of images, whereas mining appears in less than 1% of images.
As our starting point, we train a very simple CNN with 3 convolutional layers each followed by a max pooling layer. The first convolutional layer is given 16 filters with the number of filters doubling in each subsequent layer. Each max pooling layer has a pool size of 2. Finally, before the output layer we have a global average pooling layer. With regards to activation functions and weight initialisation, we use RELUs for all layers bar the output layer. The output layer uses a sigmoid activation function. We choose the sigmoid as opposed to softmax as using a softmax assumes the probabilities of each of the classes are dependent, that means that the classes should mutually exclusive if we consider softmax as the activation function of the last fully connected layer. Below, we see the architecture for our baseline.
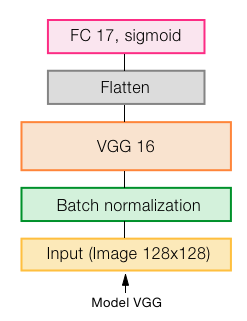
We decided to use to do transfer learning by using the VGG architecture and pretrained weights. The input and output layers of the pretrained model is removed and replaced by one suited to the new classification problem that the model is being applied to. Furthermore, with fine tuning, we do not simply use the pretrained weights as received but instead conduct further training after initialising from the pretrained weights.This can be done for a subset of the layers in the original model or for all layers. In our case we retrain the weights for all layers. Below, we see our architecture for transfer learning.
We present below the training plot for the VGG model. Notably, we used early stopping for this model before it overfits.
We present below the confusion matrix related to this model.
Below, we see the table with the results. The primary reason for using the F2 score over the F1 score is the imbalanced nature of our dataset. Certain labels are prevalent in the training set and our model will perform well in classifying images with these labels. On the other hand, the model is likely to perform poorly for the less prevalent labels and there is likely to be many false negatives for those labels. However, due to the imbalance in the dataset, there will be many more true positives than false negatives. We therefore use the F2 score to provide greater emphasis on recall and occurrences of false negatives. The F2 score is a good indicator of the overall performance of our models, but we also examine confusion matrices to better appreciate how well our models are performing for each particular label.
Without any doubt, the VGG model perfomed better.
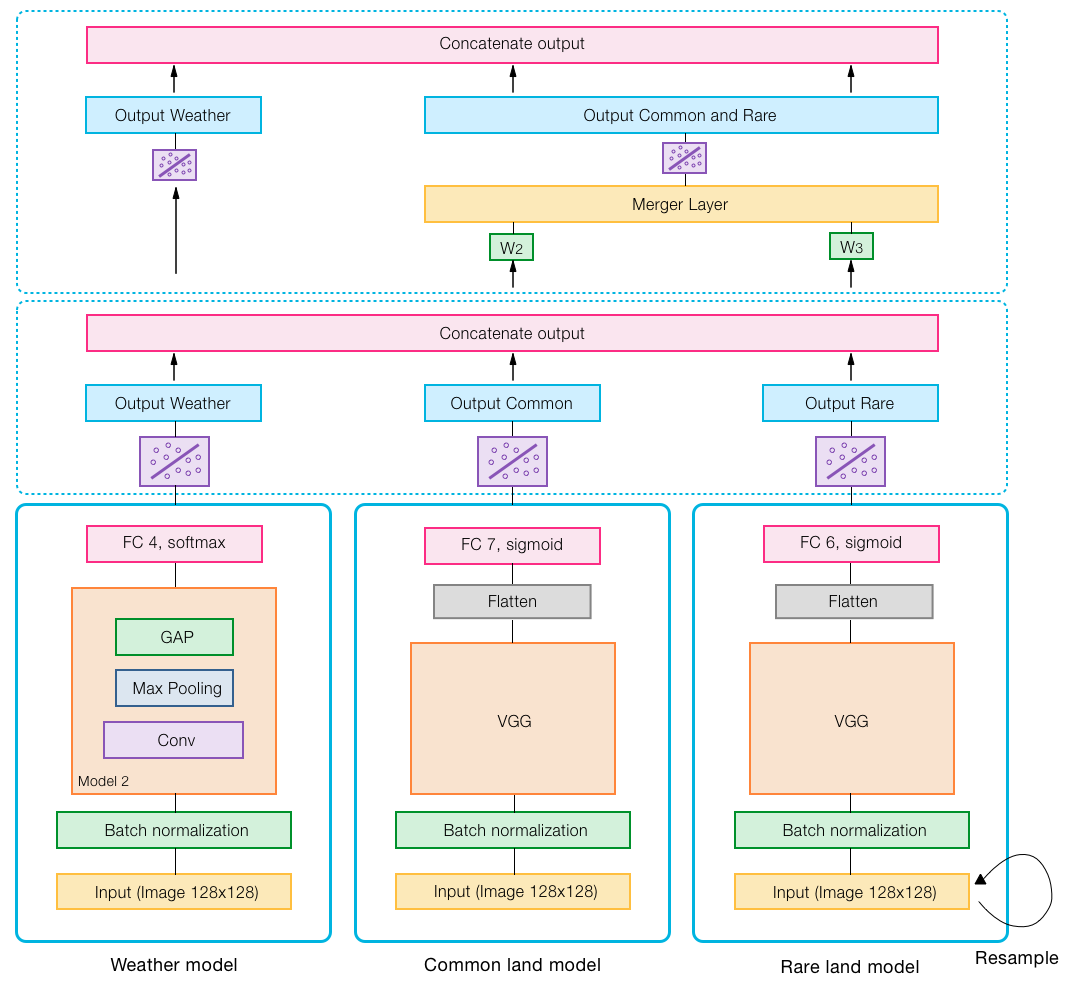
We propose the use of three networks. One for weather conditions, one for common cover/land use and one for rare cover/land use. Unlike (Liang & Tang, 2017), we do not have just the one network for cover/land use. Our motivation is that common and rare cover/land use may have different features, so having separate networks may allow them to better identify features specific to their respective labels.


