A Chrome extension to measure metrics for a healthy site Install now
This extension measures the three Core Web Vitals metrics in a way that matches how they're measured by Chrome and reported to other Google tools (e.g. Chrome User Experience Report, Page Speed Insights, Search Console).
It supports all of the Core Web Vitals and leverages the web-vitals library under the hood to capture:
It also supports the diagnostic metrics:
The Web Vitals Chrome Extenstion can be installed from the Chrome Web Store.
If you are looking for a more bleeding-edge build, you can also install the version of the extension from master.
Google Chrome
- Download this repo as a ZIP file from GitHub.
- Unzip the file and you should have a folder named
web-vitals-extension-master. - In Chrome go to the extensions page (
chrome://extensions). - Enable Developer Mode.
- Drag the
web-vitals-extension-masterfolder anywhere on the page to import it (do not delete the folder afterwards).
The Ambient Badge helps check if a page passing the Core Web Vitals thresholds.
Once installed, the extension will display a disabled state badge icon until you navigate to a URL. At this point it will update the badge to green, amber or red depending on whether the URL passes the Core Web Vitals metrics thresholds.
The badge has a number of states:
- Disabled - gray square
- Good - green circle
- One or more metrics needs improvement - amber square
- One or more metrics poor - red triangle
If one or more metrics are failing, the badge will animate the values of these metrics (this animation can be turned off in the options screen).
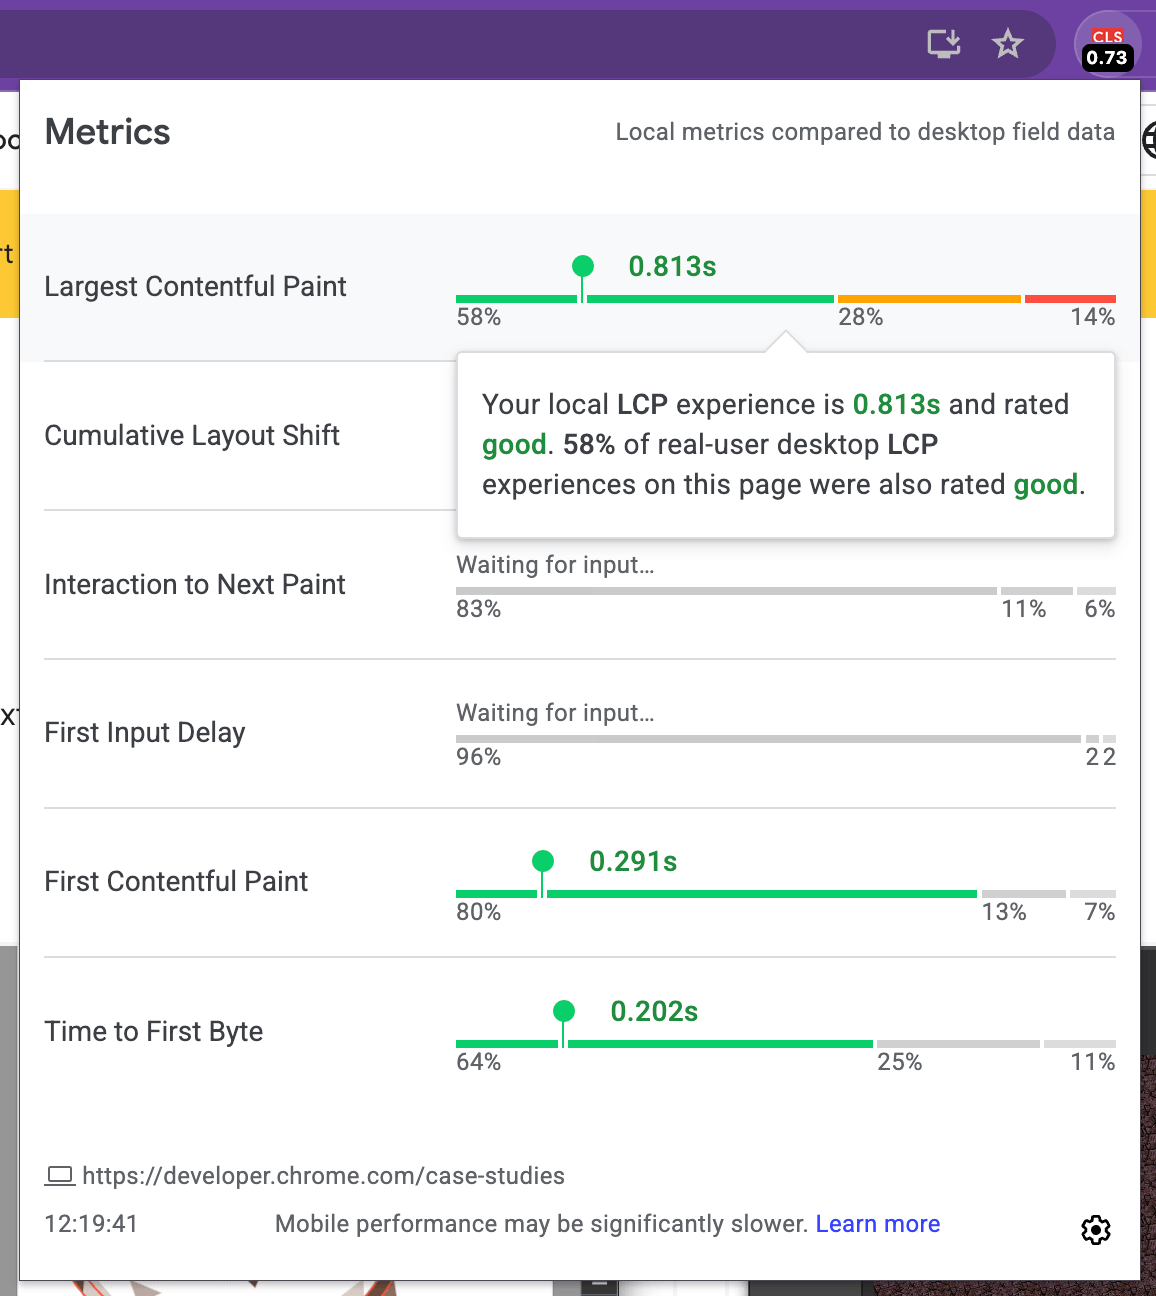
Clicking the Ambient badge icon will allow you to drill in to the individual metric values. In this mode, the extension will also say if a metric requires a user action.
For example, Interaction to Next Paint requires a real interaction (e.g click/tap) with the page and will be in a Waiting for input... state until this is the case. We recommend consulting the web.dev documentation for LCP, CLS, and INP to get an understanding of when metric values settle.
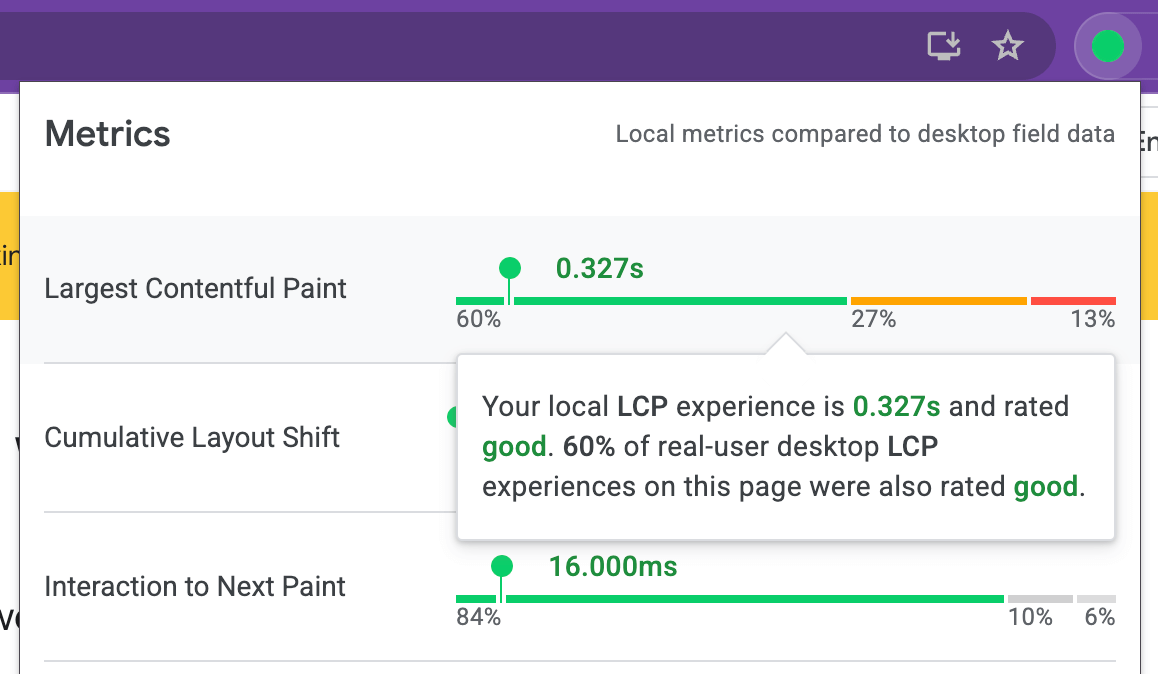
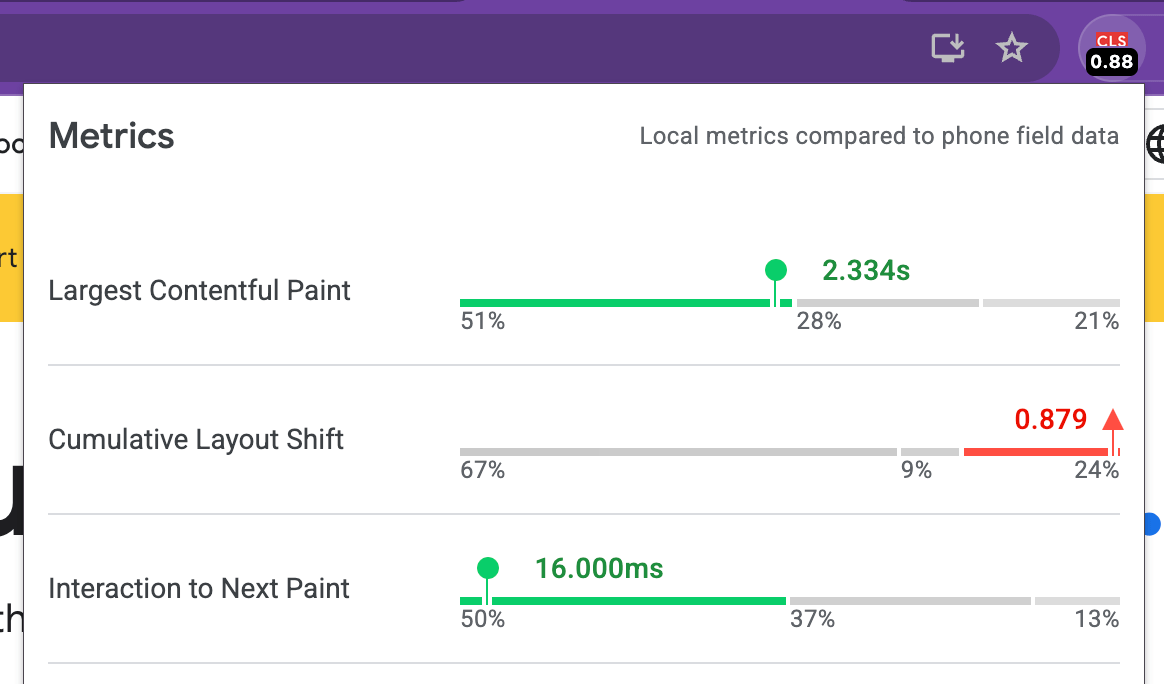
The popup combines your local Core Web Vitals experiences with real-user data from the field via the Chrome UX Report (CrUX) API. This integration gives you contextual insights to help you understand how similar your individual experiences are to other desktop users on the same page. We've also added a new option to "Compare local experiences to phone field data" instead, if needed. Note that CrUX data may not be available for some pages, in which case we try to load field data for the origin as a whole.
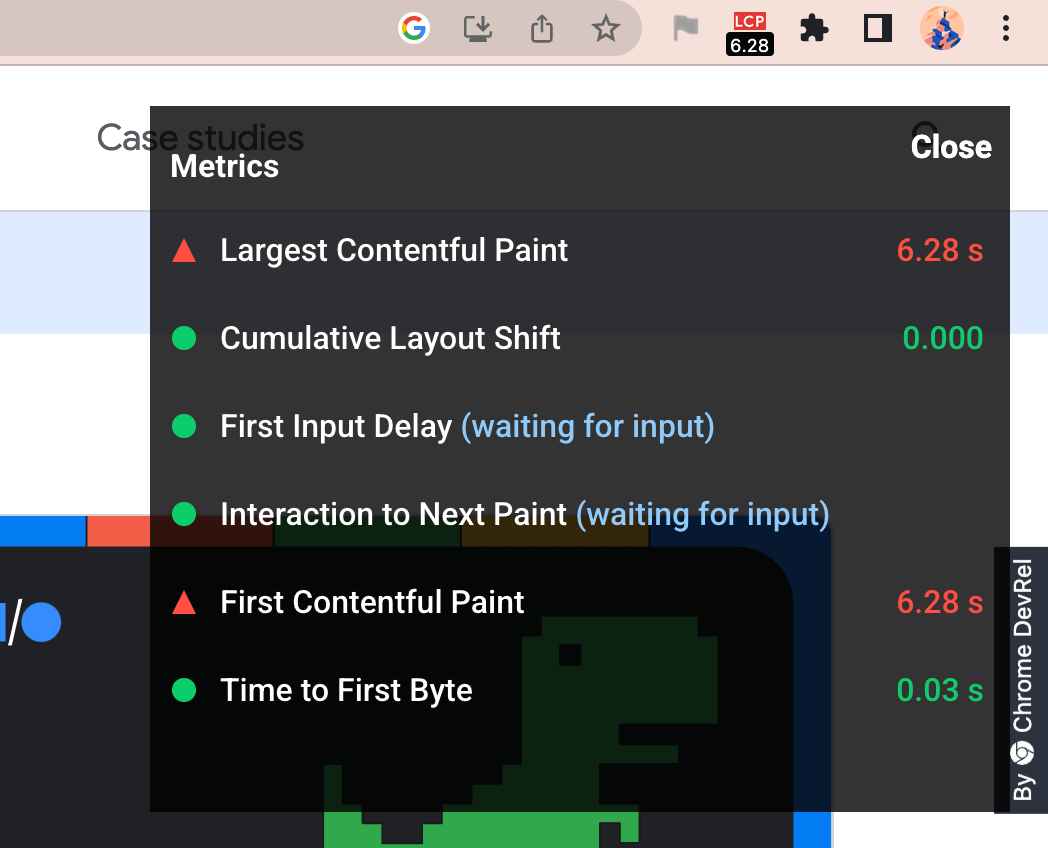
The overlay displays a Heads up display (HUD) which overlays your page. It is useful if you need a persistent view of your Core Web Vitals metrics during development. To enable the overlay:
- Right-click on the Ambient badge and go to Options.
- Check
Display HUD overlayand click 'Save' - Reload the tab for the URL you wish to test. The overlay should now be present.
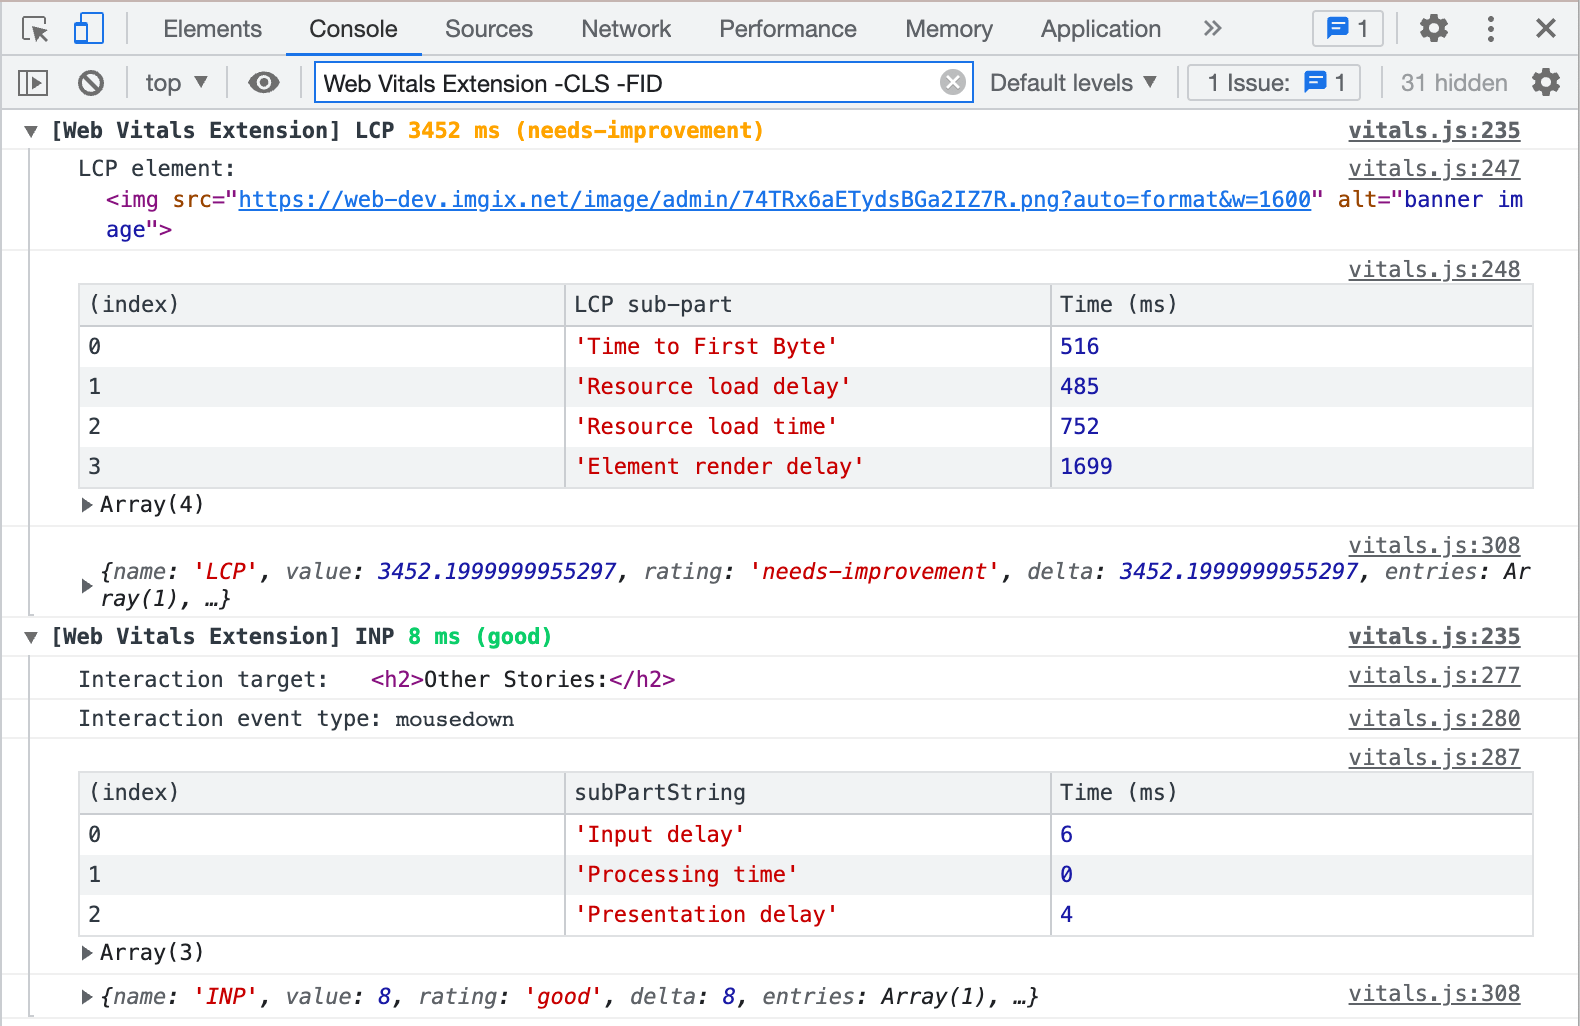
The console logging feature of the Web Vitals extension provides a diagnostic view of all supported metrics. To enable console logs:
- Right-click on the Ambient badge and go to Options.
- Check
Console loggingand click 'Save' - Open the Console panel in DevTools and filter for
Web Vitals
To filter out unneeded metrics, prepend a minus sign to the metric name. For example, set the filter to Web Vitals Extension -CLS -LCP to filter out CLS and LCP diagnostic info.
Diagnostic info for each metric is logged as a console group prepended by the extension name, [Web Vitals Extension], meaning that you will need to click this line in order to toggle the group open and closed.
The kinds of diagnostic info varies per metric. For example, the LCP info includes:
- A reference to the LCP element
- A table of LCP sub-part metrics
- An optional warning if the tab was loaded in the background
- The full attribution object from web-vitals
For some metrics (LCP and INP) the breakdowns can be saved to User Timing marks, using performance.measure which are then viewable in DevTools Performance traces.
For the other metrics, Chrome DevTools normally provides sufficient information so additional breakdowns are not necessary.
Contributions to this project are welcome in the form of pull requests or issues. See CONTRIBUTING.md for further details.
If your feedback is related to how we measure metrics, please file an issue against web-vitals directly.
src/browser_action/vitals.js: Script that leverages WebVitals.js to collect metrics and broadcast metric changes for badging and the HUD. Provides an overall score of the metrics that can be used for badging.src/bg/background.js: Performs badge icon updates using data provided by vitals.js. Passes along data topopup.jsin order to display the more detailed local metrics summary.src/browser_action/popup.js: Content Script that handles rendering detailed metrics reports in the pop-up window displayed when clicking the badge icon.src/options/options.js: Options UI (saved configuration) for advanced features like the HUD Overlay
Who is the primary audience for this extension?
The primary audience for this extension is developers who would like instant feedback on how their pages are doing on the Core Web Vitals metrics during development on a desktop machine.
How should I interpret the metrics numbers reported by this tool?
This extension reports metrics for your desktop or laptop machine. In many cases this hardware will be significantly faster than that of the median mobile phone your users may have. For this reason, it is strongly recommended that you test using tools like Lighthouse and on real mobile hardware (e.g via WebPageTest) to ensure all your users there have a positive experience.
What actions can I take to improve my Core Web Vitals?
We are making available a set of guides for optimizing each of the Core Web Vitals metrics if you find your page is not passing a particular threshold:
Lighthouse also includes additional actionability audits for these metrics.
We envision users will use the extension for instant feedback on metrics (for their desktop machine) but will then go and do a Lighthouse audit for (1) a diagnostic view of how these metrics look on a median mobile device and (2) specifically what you can do to improve.
