This guide shows how to run the OpenTelemetry Collector to collect metrics, traces, and logs in a Cloud Run deployment. This uses the Cloud Run multicontainer (sidecar) feature to run the Collector as a sidecar container alongside your workload container.
Learn more about sidecars in Cloud Run (currently a preview feature) here.
The following steps walk you through setting up a sample app on Cloud Run that exports telemetry data to GMP and Cloud Trace.
- Enable the Cloud Run API in your Google Cloud project.
- Enable the Artifact Registry API in your Google Cloud project.
- Authenticate with your Google Cloud project in a local terminal.
To enable the depending service APIs with gcloud command, you can the following commands.
gcloud services enable run.googleapis.com --quiet
gcloud services enable artifactregistry.googleapis.com --quiet
gcloud services enable cloudtrace.googleapis.com --quiet
gcloud services enable monitoring.googleapis.com --quiet
To run the sample app, you will also need to make sure your Cloud Run Service Account has, at minimum, the following IAM roles:
roles/monitoring.metricWriterroles/cloudtrace.agentroles/logging.logWriter
The default Compute Engine Service Account has these roles already.
Because this sample requires docker or similar container build system for Linux runtime, you can use Cloud Build when you are trying without local Docker support. To enable Cloud Build, you need to enable Cloud Build API in your Google Cloud project.
gcloud services enable cloudbuild.googleapis.com --quietThe bundled configuration file for Cloud Build (cloudbuild.yaml) requires a new servcie account with the following roles or stronger:
roles/iam.serviceAccountUserroles/storage.objectViewerroles/logging.logWriterroles/artifactregistry.createOnPushWriterroles/run.admin
Running create-service-account.sh creates a new service account run-otel-example-sa@<project-id>.iam.gserviceaccount.com for you. Then launch a Cloud Build task with gcloud command.
./create-service-account.sh
gcloud builds submit . --config=cloudbuild.yaml
After the build, run the following command to check the endpoint URL.
gcloud run services describe opentelemetry-cloud-run-sample --region=us-east1 --format="value(status.url)"The app directory contains a sample app written in Go. This app generates some
simple metrics, traces, and writes logs to a local file. It is instrumented with
OpenTelemetry libraries to push that telemetry data to an OpenTelemetry
Collector endpoint.
Create an Artifact Registry container image repository with the following commands:
export GCP_PROJECT=<project-id>
gcloud artifacts repositories create run-otel-example \
    --repository-format=docker \
    --location=us-east1
Authenticate your Docker client with gcloud:
gcloud auth configure-docker \
    us-east1-docker.pkg.dev
Build and push the app with the following commands:
pushd app
docker build -t us-east1-docker.pkg.dev/$GCP_PROJECT/run-otel-example/sample-app .
docker push us-east1-docker.pkg.dev/$GCP_PROJECT/run-otel-example/sample-app
popd
The collector directory contains a Dockerfile and OpenTelemetry Collector
config file. The Dockerfile builds a Collector image that bundles the local
config file with it.
Build the Collector image with the following commands:
pushd collector
docker build -t us-east1-docker.pkg.dev/$GCP_PROJECT/run-otel-example/collector .
docker push us-east1-docker.pkg.dev/$GCP_PROJECT/run-otel-example/collector
popd
The run-service.yaml file defines a multicontainer Cloud Run Service with the
sample app and Collector images built above.
Replace the %SAMPLE_APP_IMAGE% and %OTELCOL_IMAGE% placeholders in
run-service.yaml with the images you built above, ie:
sed -i s@%OTELCOL_IMAGE%@us-east1-docker.pkg.dev/${GCP_PROJECT}/run-otel-example/collector@g run-service.yaml
sed -i s@%SAMPLE_APP_IMAGE%@us-east1-docker.pkg.dev/${GCP_PROJECT}/run-otel-example/sample-app@g run-service.yaml
Create the Service with the following command:
gcloud run services replace run-service.yaml
This command will return an external URL for your Service’s endpoint. Save this and use it in the next section to trigger the sample app so you can see the telemetry collected by OpenTelemetry.
Finally before you make make the request to the URL, you need to change the Cloud Run service policy to accept unauthenticated HTTP access.
gcloud run services set-iam-policy opentelemetry-cloud-run-sample policy.yaml
Use curl to make a request to your Cloud Run Service’s endpoint URL:
export SERVICE_URL=<service-url>
curl $SERVICE_URL
This should return the following output on success:
Logged request to /logging/sample-app.log
Generated 10 spans!
Updated sidecar-sample-counter metric!
(It may be helpful to run the curl command several times to produce
more interesting telemetry.)
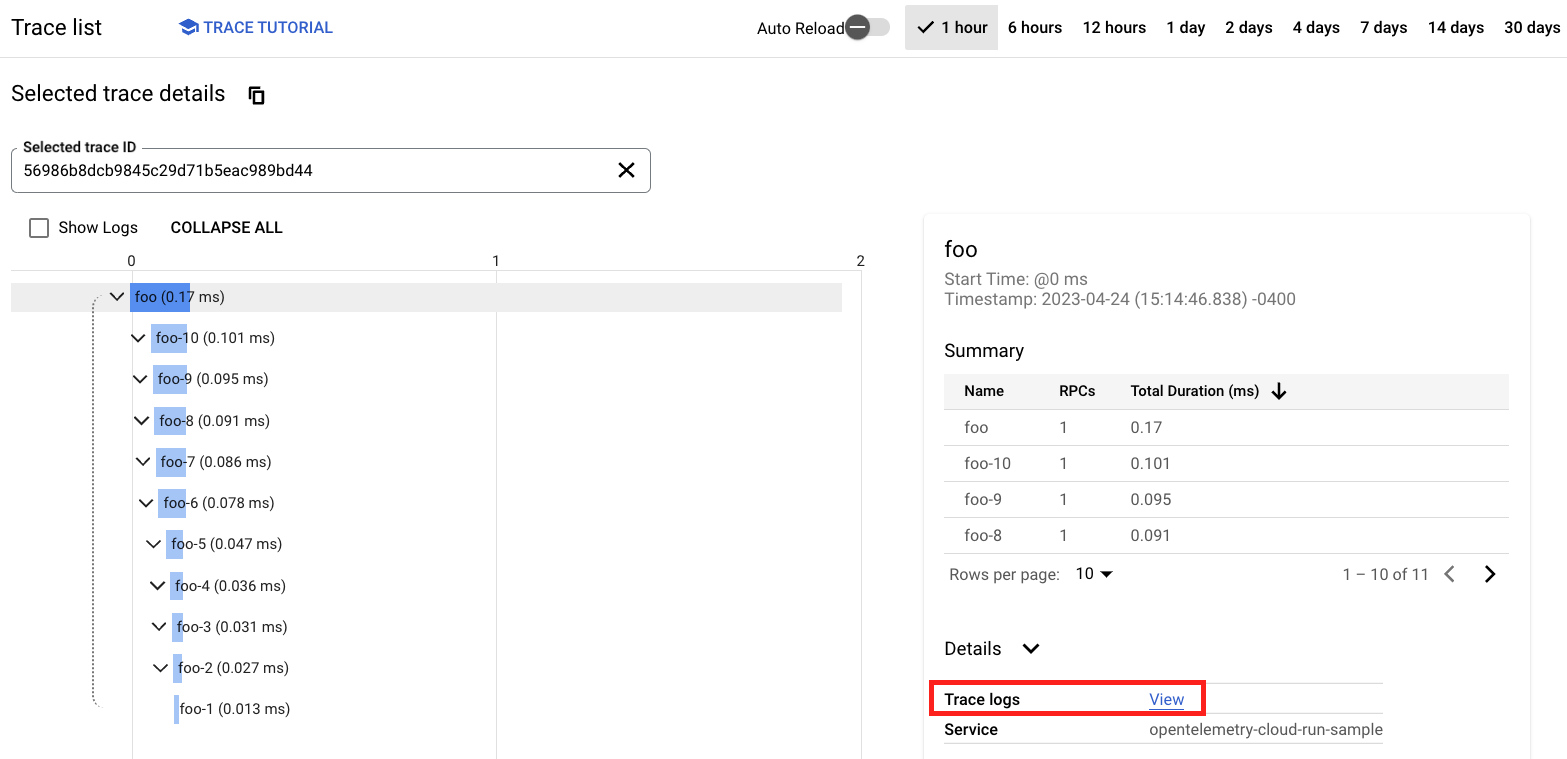
Navigate to the Cloud Trace UI to see your traces:
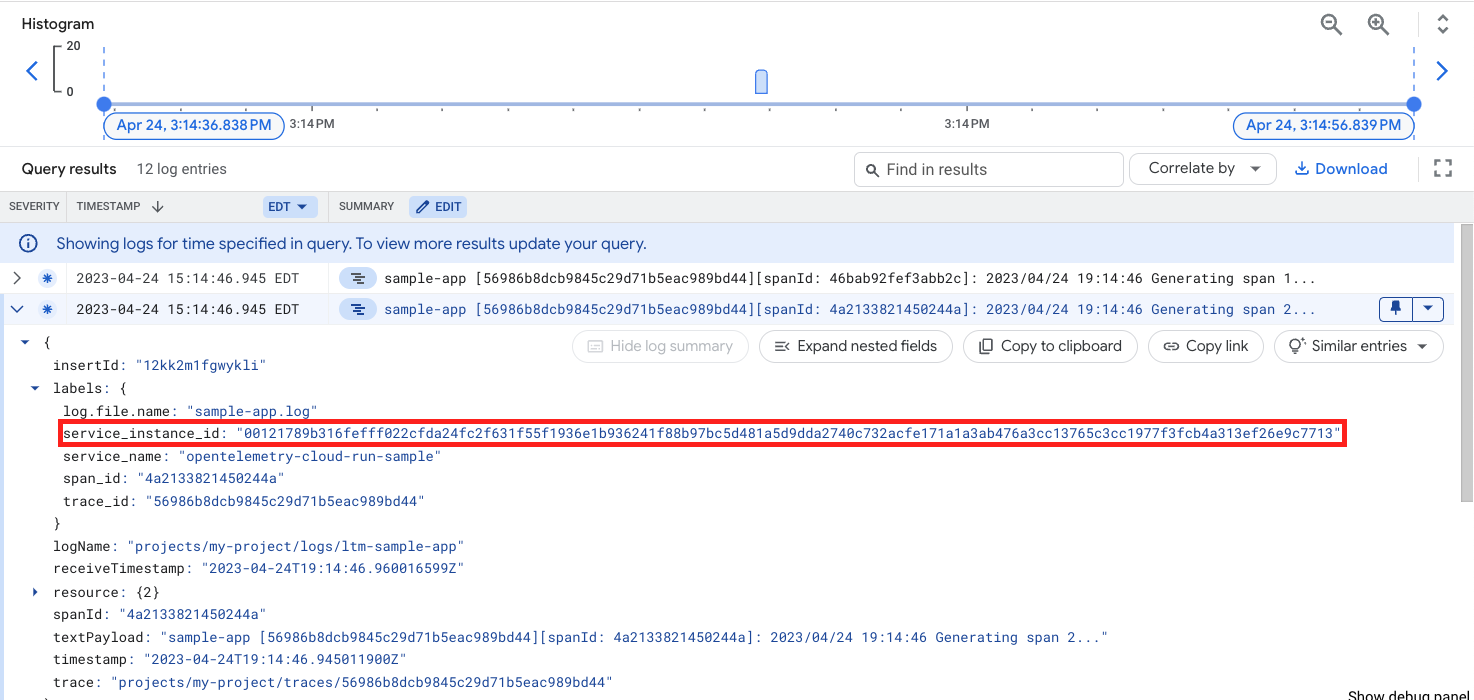
Click the Trace Logs: view link to see logs automatically associated with this trace:
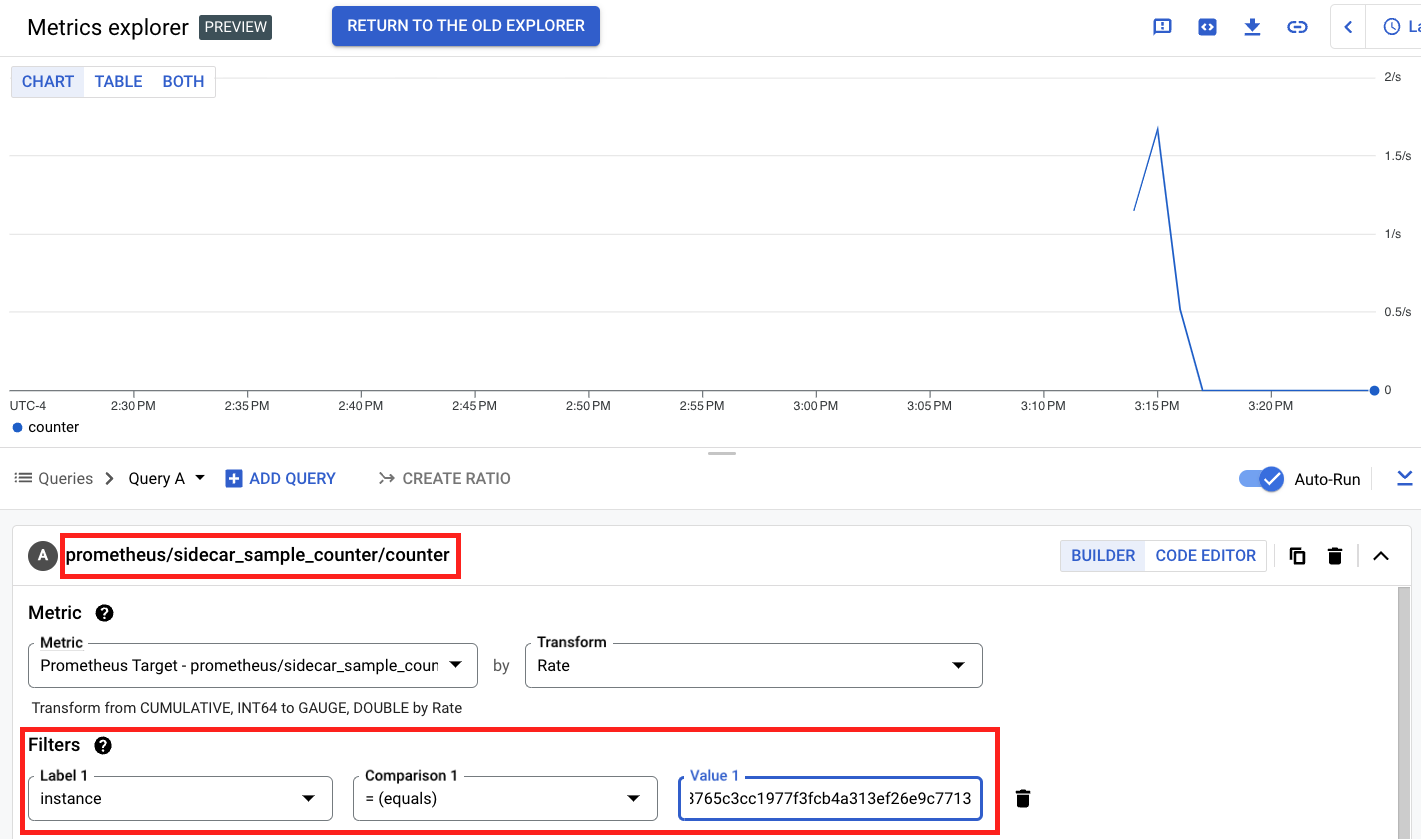
Note the service_instance_id label that corresponds to the Cloud Run instance
that produced this log line. Copy that value, then search for it in the Cloud
Monitoring Metrics Explorer UI under the metric named sidecar_sample_counter:
This pattern can be applied to run any OpenTelemetry Collector in Cloud Run. The
configs directory contains a few more Collector configs that can
be applied to common use cases in GCP.
To use these configs, replace collector/collector-config.yaml with the file
you want and follow the steps above starting from Build the Collector Image to
bundle and deploy your new config.
After running the demo, please make sure to clean up your project so that you don't consume unexpected resources and get charged.
gcloud run services delete opentelemetry-cloud-run-sample --region us-east1 --quiet
gcloud artifacts repositories delete run-otel-example \
  --location=us-east1 \
  --quiet

