Hubble is a dashboard that displays in a terminal with any data you provide via http. It also allows you to setup thresholds if a number goes above/under a certain value. You can have any webhooks, programs, workers, scripts, etc just send an http post request (or setup an api endpoint to poll) and it will get placed on the dashboard. Be creative!!
-
To install,
git clone git@github.com:jaymedavis/hubble.gitsomewhere on your machine. Go into the hubble directory and runnpm install -
Modify config.coffee to your tastes
module.exports = title: 'Hubble Space Dashboard' border: '*'
server: port: 9999 # for more information about available options, see https://github.com/Marak/colors.js colors: title: 'green' border: 'grey' high: 'red' low: 'red' columns: 2 # how many vertical columns of data for your dashboard -
Run
./hubble.coffeeto start your dashboard!
Upon your first launch of Hubble, you will see a screen like below
Hubble is built behind the idea that you http post information to the server to configure and populate it.
**column** - 0, 1, etc... defines which column the data goes in. (max columns are defined in config.coffee)
**label**  - the name of the data point to be displayed in the console
**high**   - only works with numbers. this is the over-the-threshold amount (the number will display as configured in config.coffee [red])
**low**    - only works with numbers. this is the below-the-threshold amount (the number will display as configured in config.coffee [also red])
**value** - the value of the data point (a specified value)
**increment**
**poll_url**      - the url of the web request
**poll_seconds**  - how often to poll for data changes
**poll_failed**   - the message to display if the request fails
**poll_method**   - the method to apply to the result for displaying (sorry, only "count_array" until I get around to building more)
Now it's time to give it some data! Since we configured it to have two columns, lets put some data in.
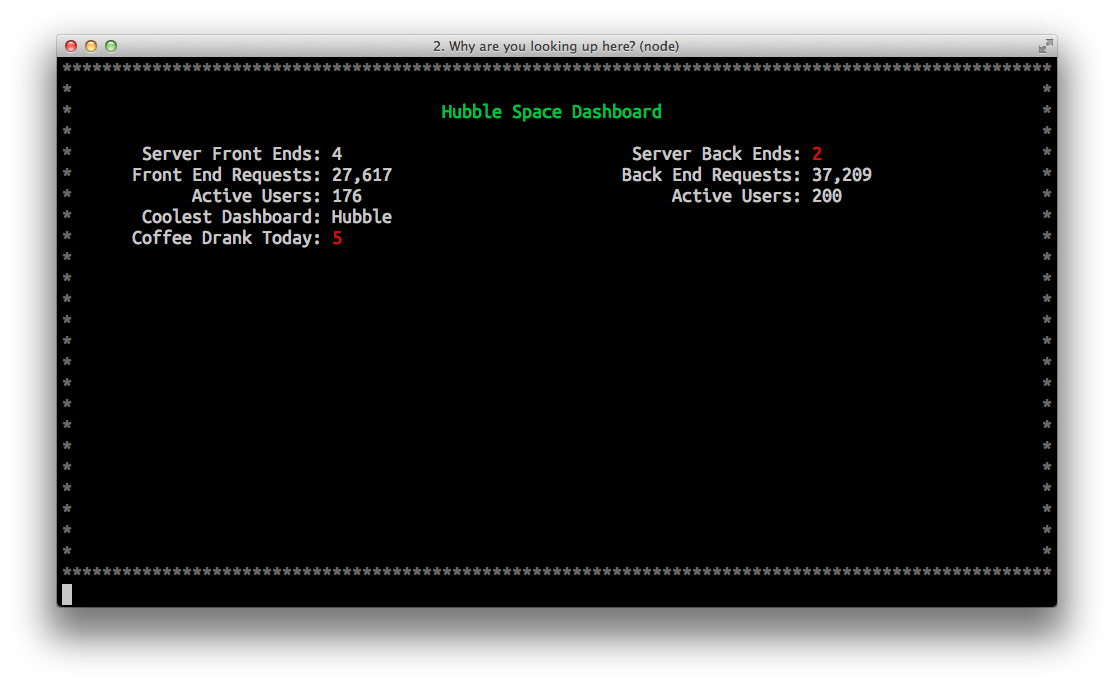
Let's post how many front end and back end servers we have running. If we go under 3, we want it to display the color of the low threshold (red). Let's also post some other random data.
curl --data "id=1&column=0&label=Server%20Front%20Ends&value=4&low=3" http://localhost:9999/
curl --data "id=1&column=1&label=Server%20Back%20Ends&value=2&low=3"  http://localhost:9999/

curl --data "id=2&column=0&label=Front%20End%20Requests&value=27,617" http://localhost:9999/
curl --data "id=2&column=1&label=Back%20End%20Requests&value=37,209"  http://localhost:9999/

curl --data "id=3&column=0&label=Active%20Users&value=176" http://localhost:9999/
curl --data "id=3&column=1&label=Active%20Users&value=200" http://localhost:9999/

curl --data "id=4&column=0&label=Coolest%20Dashboard&value=Hubble"  http://localhost:9999/
curl --data "id=5&column=0&label=Coffee%20Drank%20Today&value=5&high=4" http://localhost:9999/
After adding some data, setting some thresholds, the dashboard will now look like below
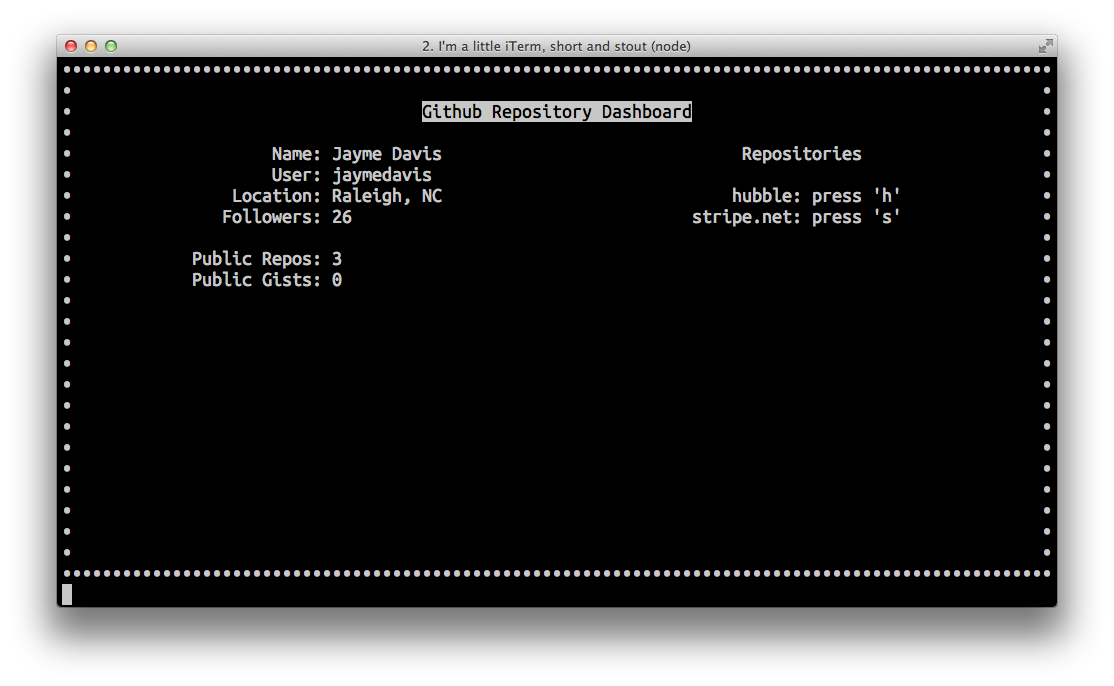
Let's setup a few API calls that we'll use for polling. We will track some information about our repository, and have it update every 10 seconds. Lets also change up the colors in the config just for fun. :)
Note: if there are no commits for the project you are working with, there is nothing to count so it shows "Bummer :(". Also, you don't have to supply the '[github:username]:[github:password]' in the api requests, but it will allow you to poll more often (5000 requests per hour vs 60 requests per hour)
curl http://localhost:9999 \
-d id=1 \
-d column=0 \
-d label="Repository Name" \
-d value="Hubble"

curl http://localhost:9999 \
-d id=2 \
-d column=0 \
-d label="Total Collaborators" \
-d poll_url="https://[github:username]:[github:password]@api.github.com/repos/jaymedavis/hubble/collaborators" \
-d poll_seconds=10 \
-d poll_failed="Bummer :(" \
-d poll_method="count_array"

curl http://localhost:9999 \
-d id=3 \
-d column=0 \
-d label="Total Forks" \
-d poll_url="https://[github:username]:[github:password]@api.github.com/repos/jaymedavis/hubble/forks" \
-d poll_seconds=10 \
-d poll_failed="Bummer :(" \
-d poll_method="count_array"

curl http://localhost:9999 \
-d id=1 \
-d column=1 \
-d label="Total Open Issues" \
-d high="1" \
-d poll_url="https://[github:username]:[github:password]@api.github.com/repos/jaymedavis/hubble/issues?state=open" \
-d poll_seconds=10 \
-d poll_failed="Bummer :(" \
-d poll_method="count_array"

curl http://localhost:9999 \
-d id=2 \
-d column=1 \
-d label="Total Closed Issues" \
-d poll_url="https://[github:username]:[github:password]@api.github.com/repos/jaymedavis/hubble/issues?state=closed" \
-d poll_seconds=10 \
-d poll_failed="Bummer :(" \
-d poll_method="count_array"

curl http://localhost:9999 \
-d id=3 \
-d column=1 \
-d label="Total Commits" \
-d poll_url="https://[github:username]:[github:password]@api.github.com/repos/jaymedavis/hubble/commits" \
-d poll_seconds=10 \
-d poll_failed="Bummer :(" \
-d poll_method="count_array"

curl http://localhost:9999 \
-d id=4 \
-d column=1 \
-d label="Total Comments" \
-d poll_url="https://[github:username]:[github:password]@api.github.com/repos/jaymedavis/hubble/comments" \
-d poll_seconds=10 \
-d poll_failed="Bummer :(" \
-d poll_method="count_array"
Your dashboard should now look like below and auto update every 10 seconds. :)
Any item with a numeric value can be incremented by passing increment as a POST field.
The item will be incremented by the value specified in the value field.
curl http://localhost:9999 \
-d label="Test Value" \
-d id=1 \
-d column=0 \
-d value=10 \
-d low=20 \
-d high=40
Now we can increment the Test Value using:
curl http://localhost:9999 \
-d id=1 \
-d column=0 \
-d value=10 \
-d increment
I really have enjoyed working on this project and would love to hear how you use it. Shoot me an email or a twitter message (@jaymed), I'd appreciate it!