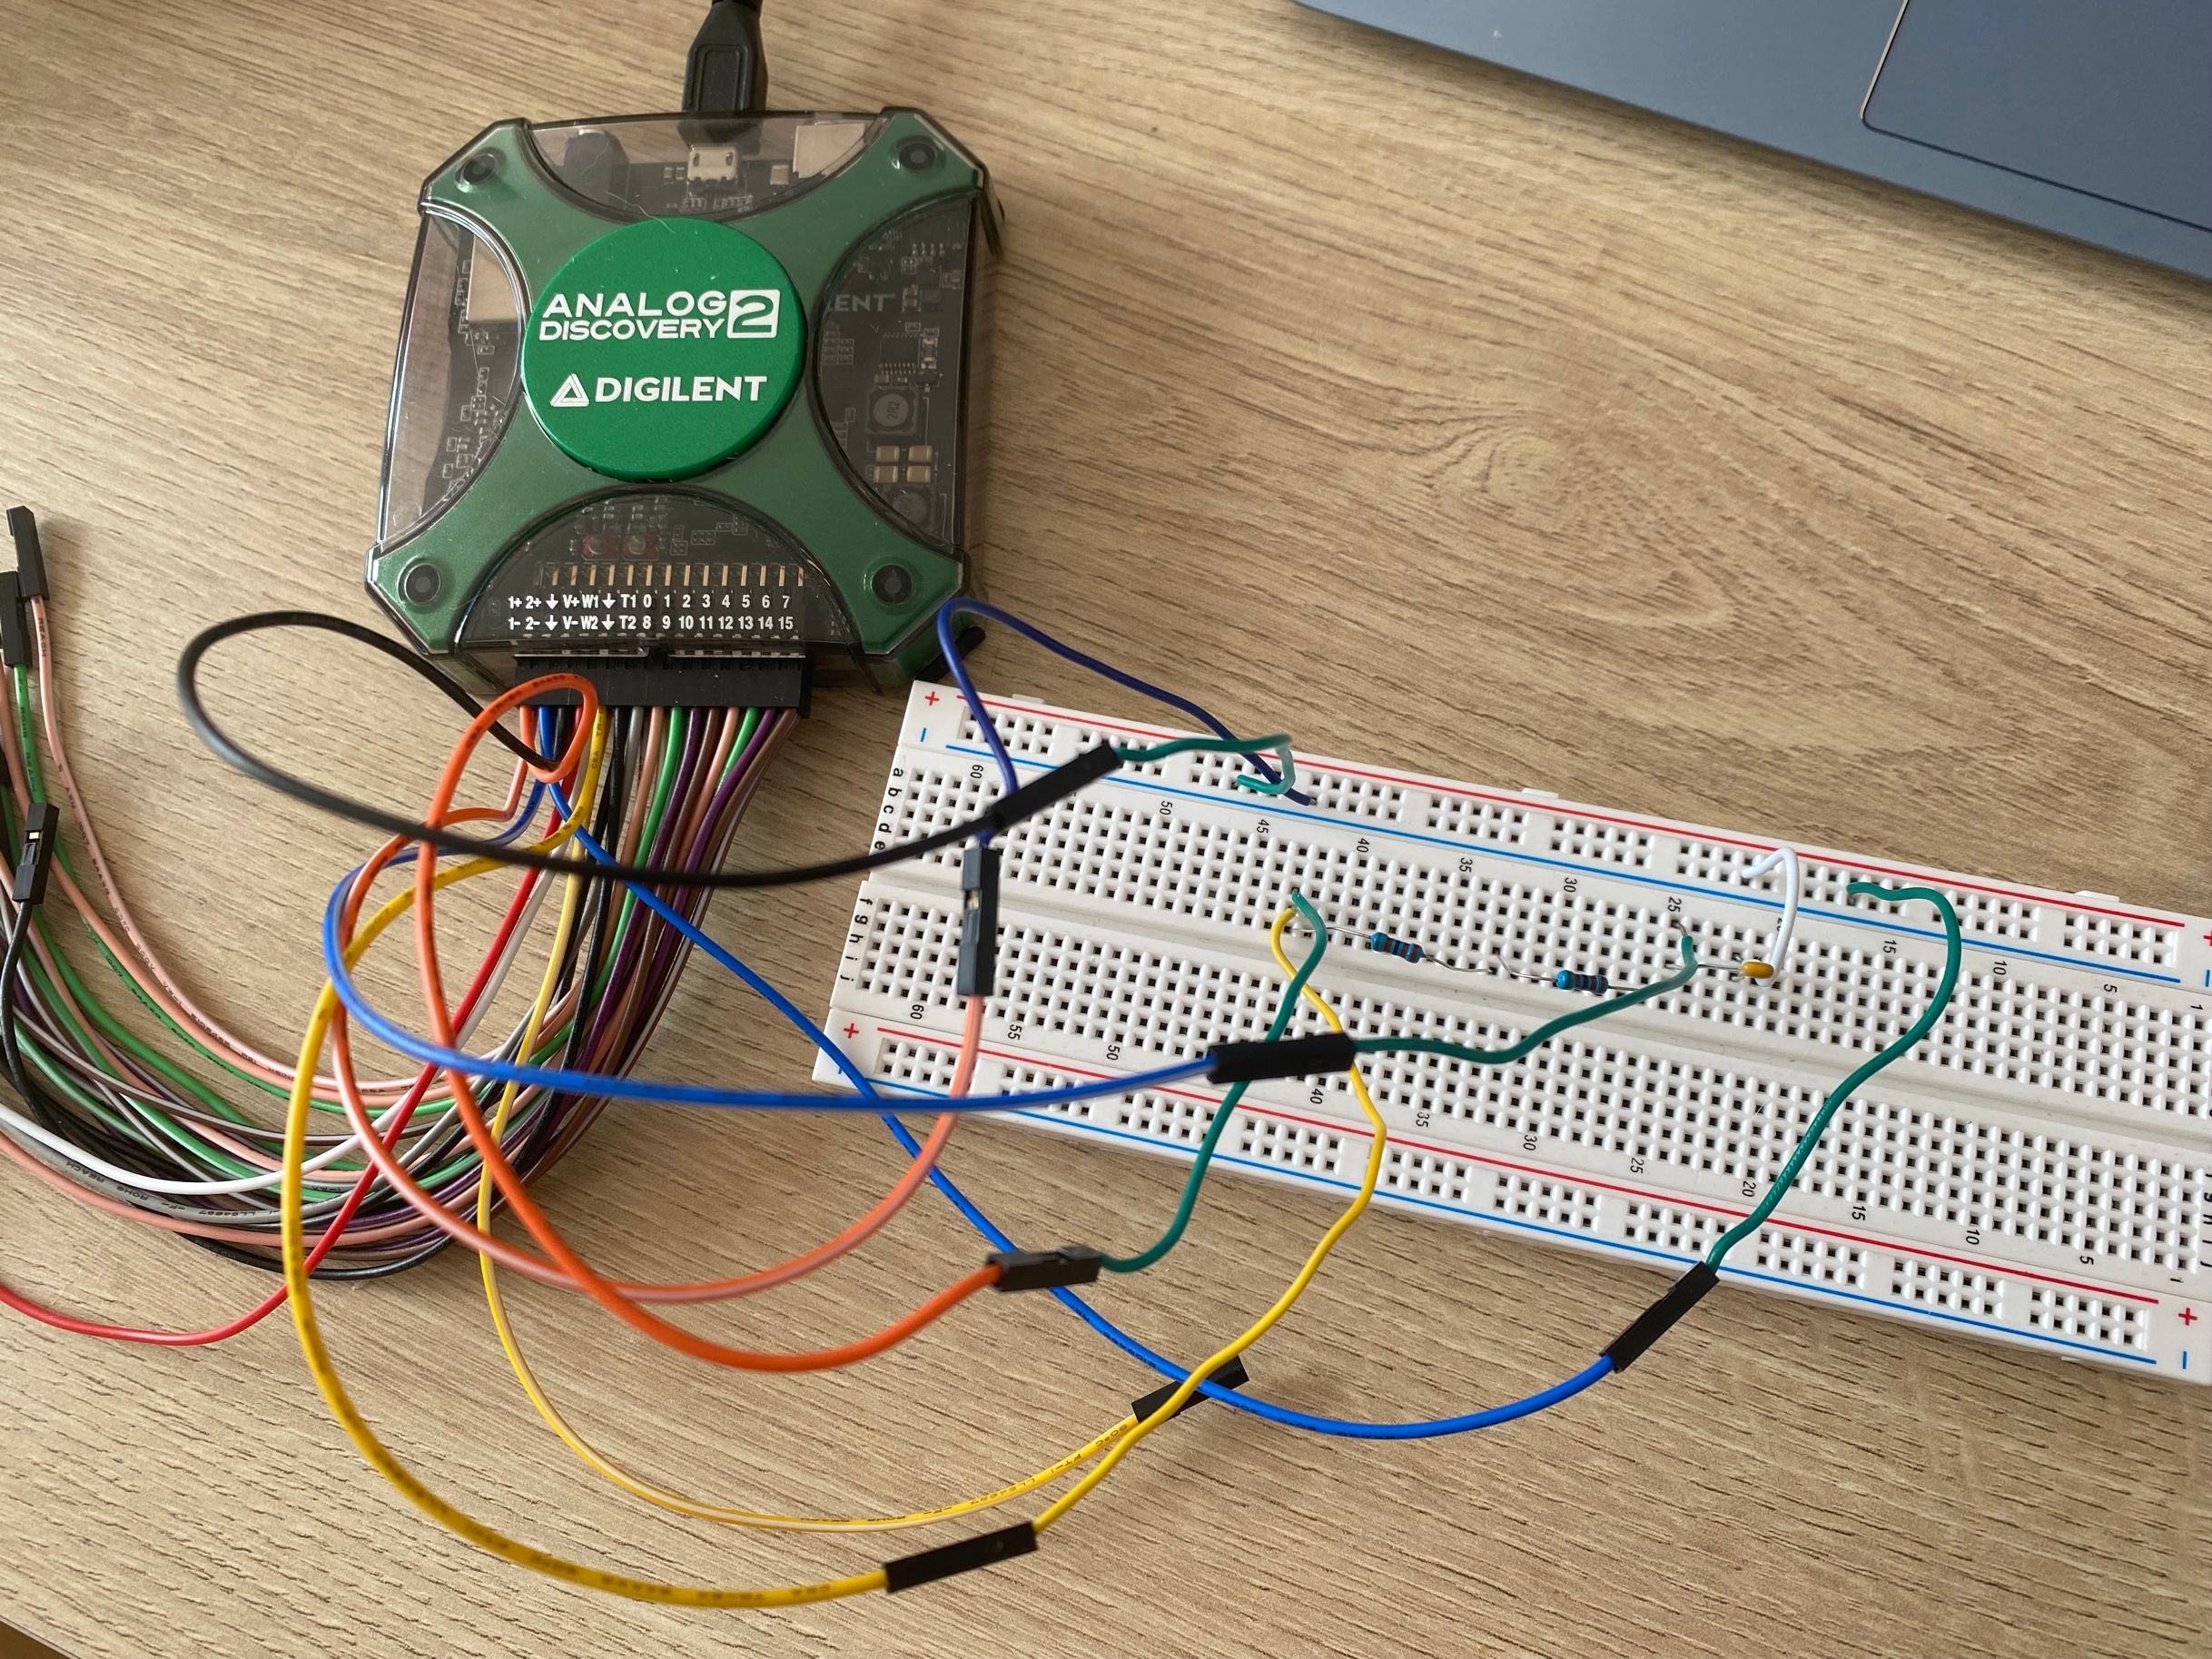
WaveForms is the virtual instrument suite for Electronics Explorer, Digital Discovery, Analog Discovery, Analog Discovery 2 and Analog Discovery Studio devices.
The Digilent Analog Discovery 2™, developed in conjunction with Analog Devices®, is a multi-function instrument that allows users to measure, visualize, generate, record, and control mixed signal circuits of all kinds. The low-cost Analog Discovery 2 is small enough to fit in your pocket, but powerful enough to replace a stack of lab equipment, providing engineering students, hobbyists, and electronics enthusiasts the freedom to work with analog and digital circuits in virtually any environment, in or out of the lab.
The installation process and the introduction to the interface of Waveforms are currently available on the Internet. In this tutorial, we will not repeat them.
- software Waveforms
- Analog Discovery 2
- A breadboard
- Two light-emitting diodes
- Some resistors
- some capacitors
- Some connection cables
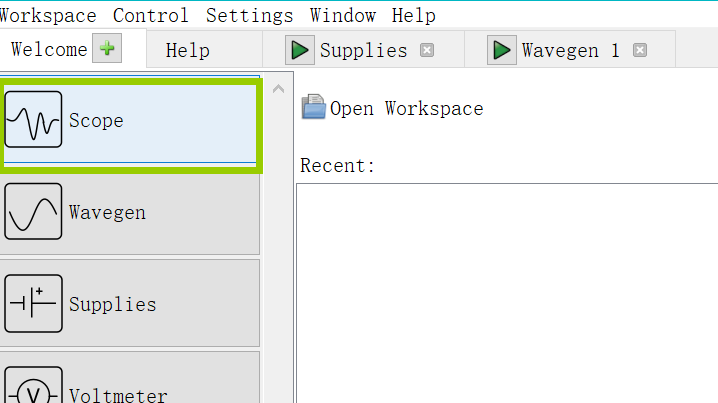
The simplest function of the AD2 is to generate DC voltages, click on "Supplies" in the welcome screen.
Set both the positive and negative voltages to 5V and, when the connection is complete, click to start
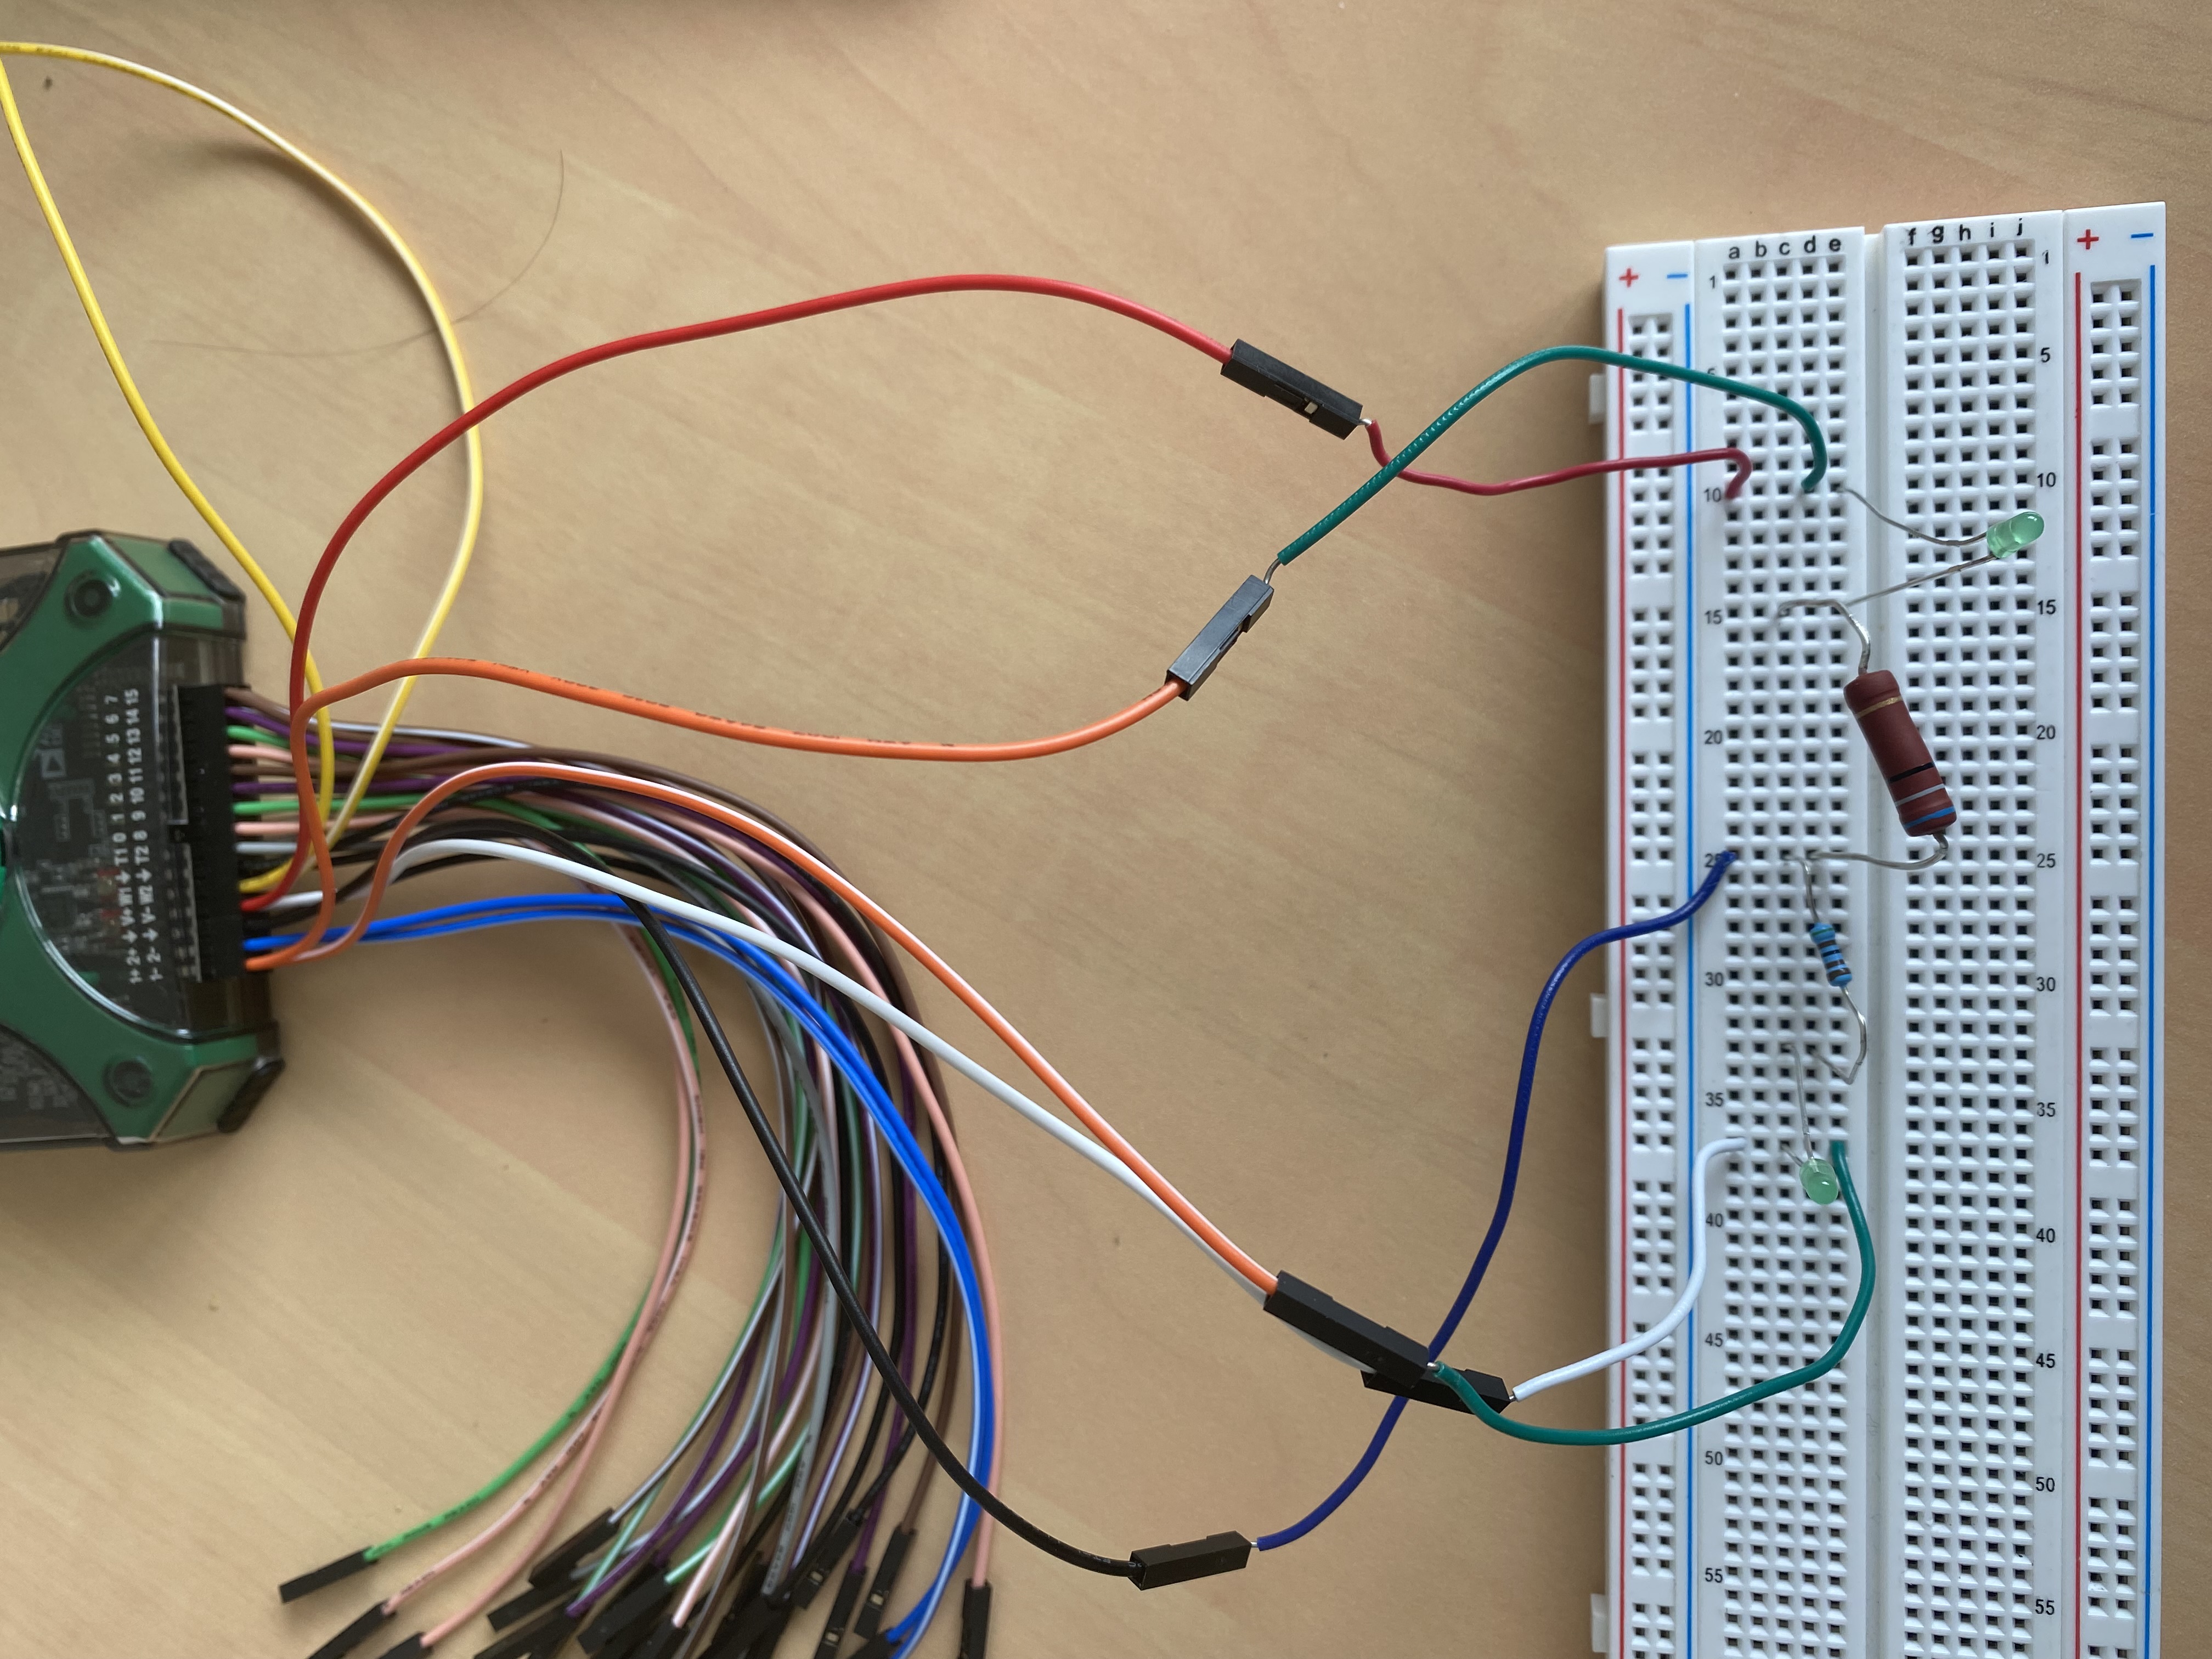
This connection uses two resistors and two light emitting diodes, connected into the circuit in the order diode, resistor, resistor, diode. At this point the V+ port is connected to the positive side of the circuit, the ground is connected to the junction of the two resistors, and the V- port is connected to the negative side of the circuit.
The main purpose of the second linkage is to make it clear that the difference between V- and ground.
This example is designed to understand the function of "wavegen".
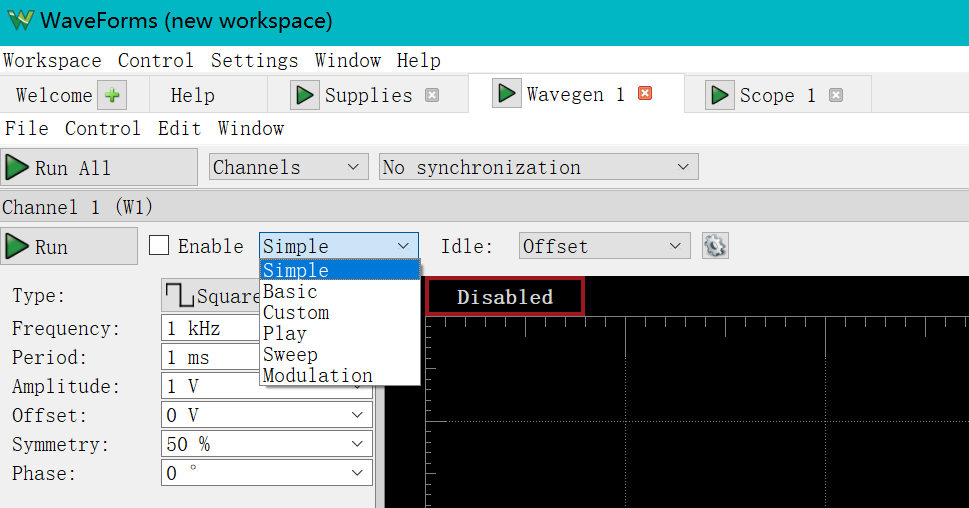
In the "type" section wecan select different types of simple waveforms, here is an example of a square wave:
Set the amplitude to 3V, connect the wires and observe the circuit
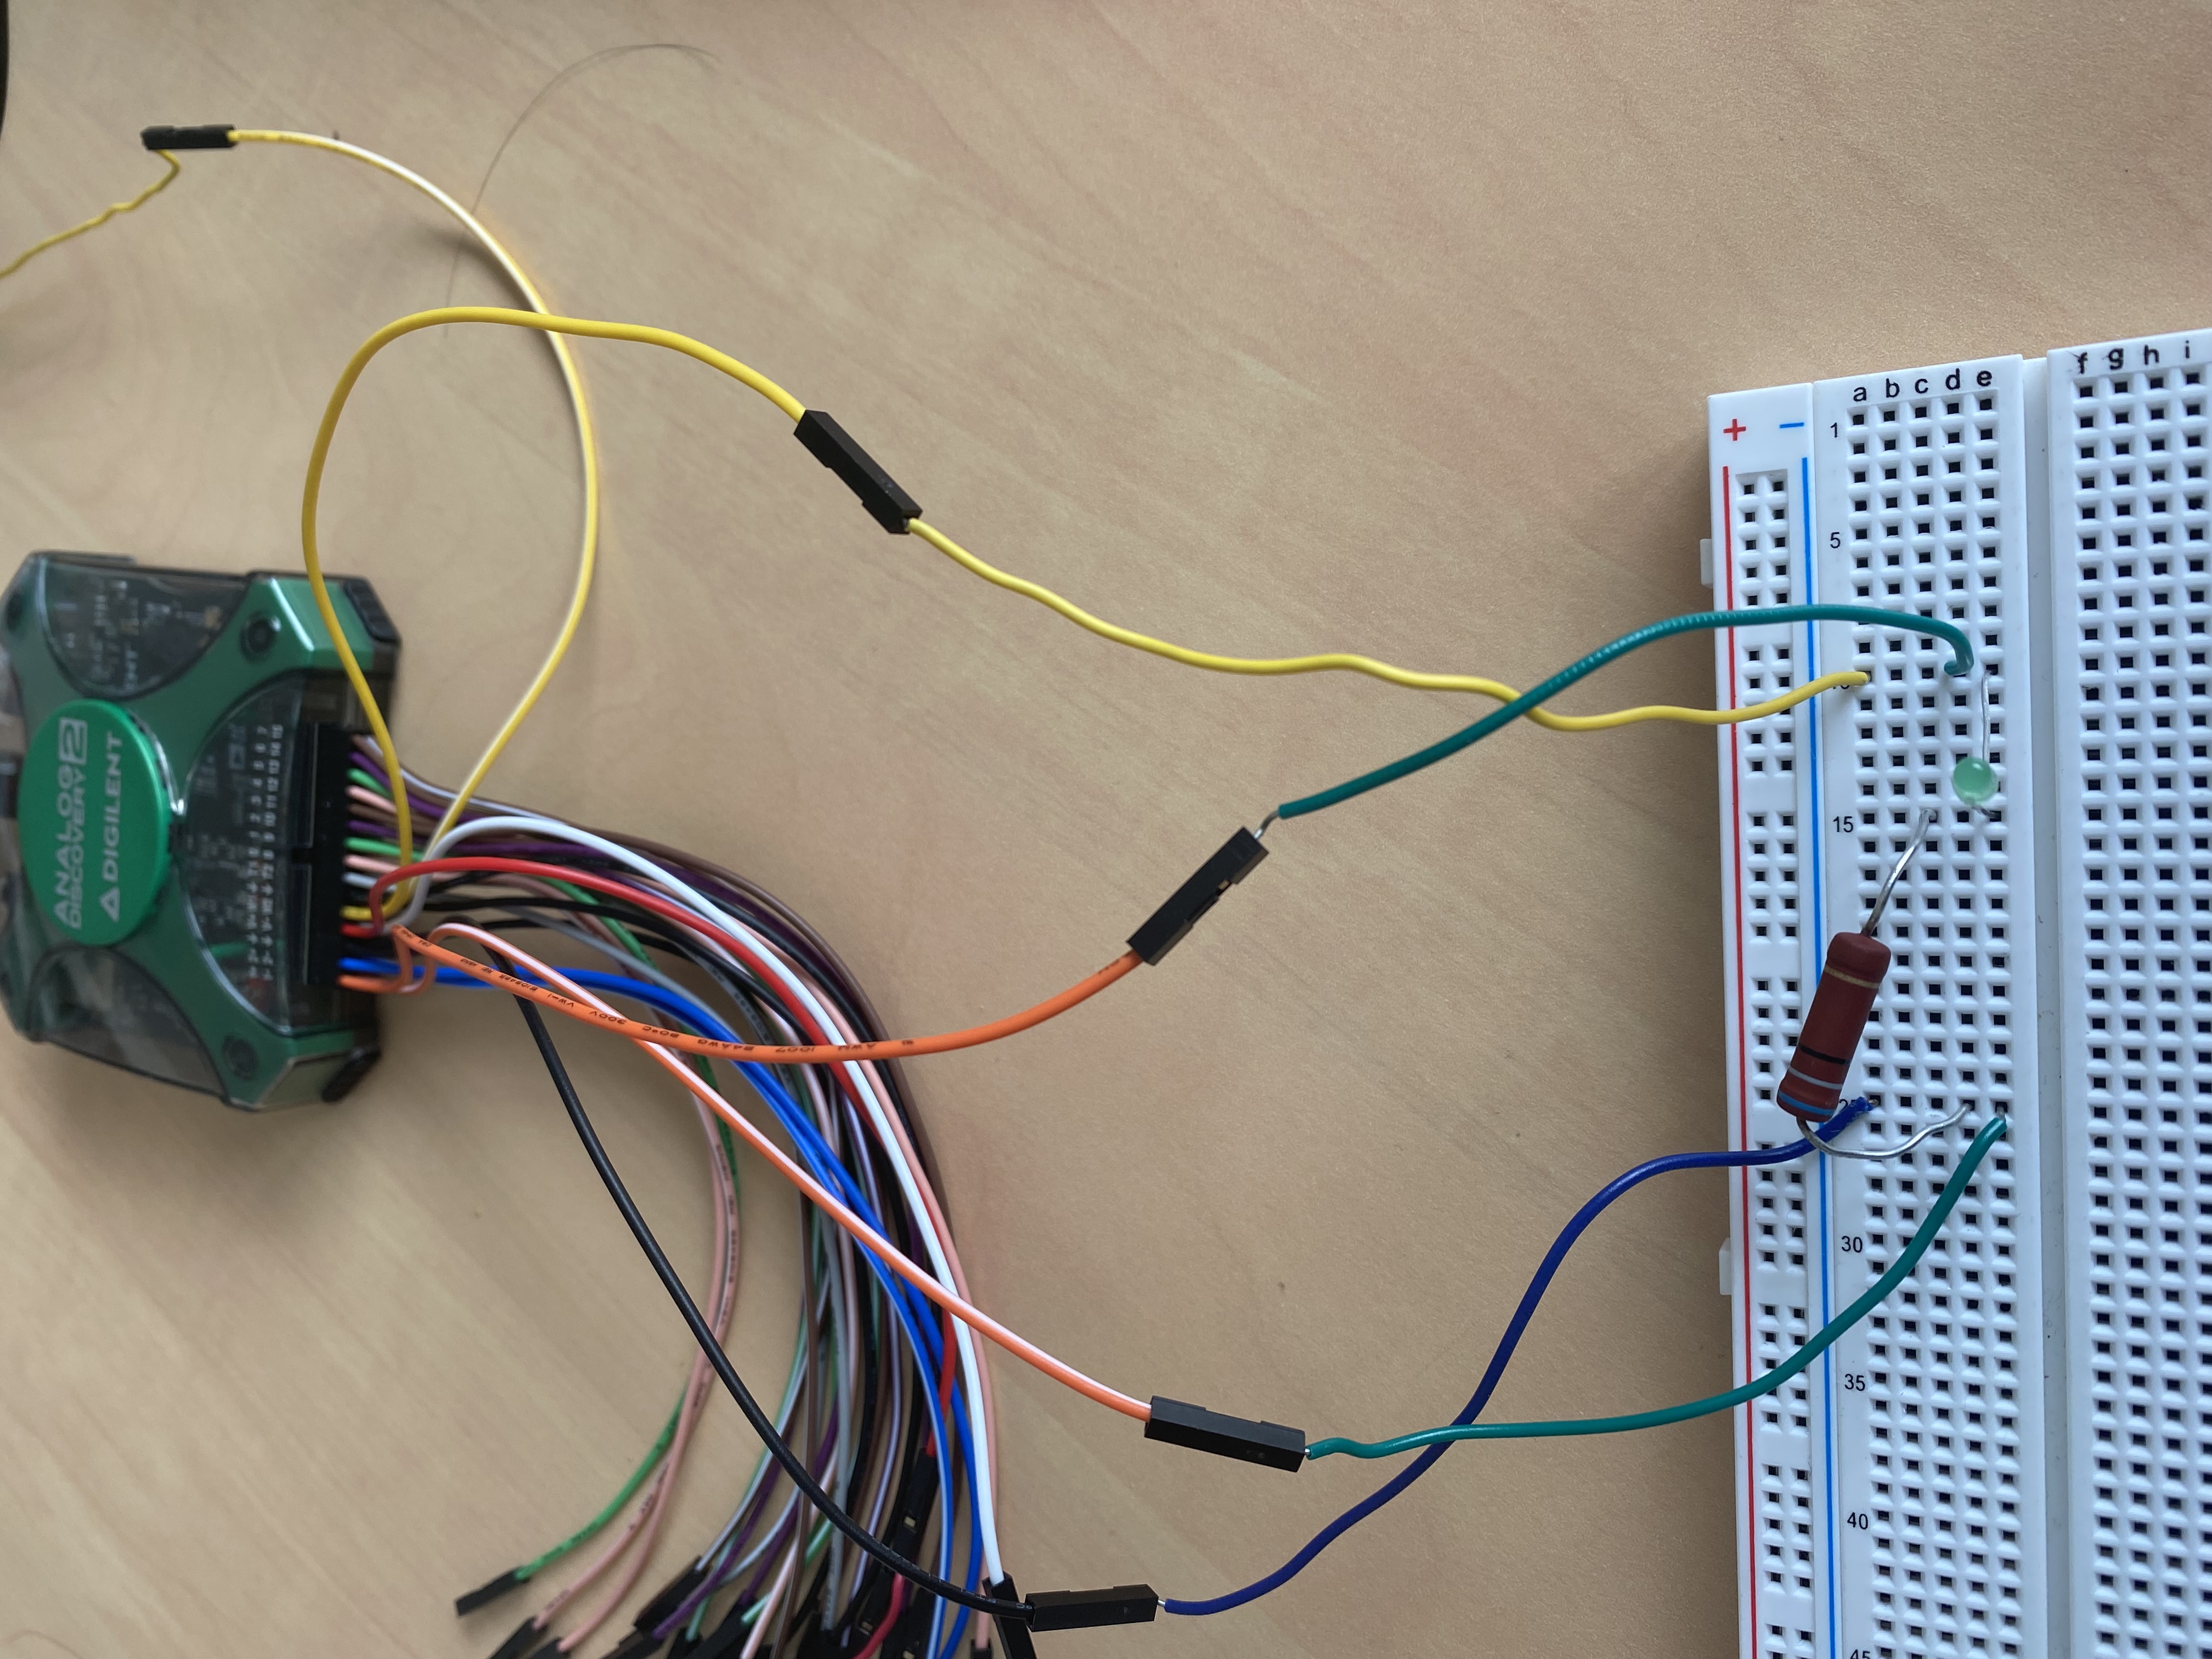
This connection select a resistor of about 1k ohms, connect it in series with a light emitting diode in the circuit, W1 port connected to the positive side of the circuit, ground connected to the negative side of the circuit, the specific wiring diagram is as follows:
When the connection is complete, click on "run" in the "wavegen" screen and you should see the diodes flashing.
You can try to change the frequency, amplitude and duty cycle of the signal.
The "Scope" helps us to look at signals in detail.
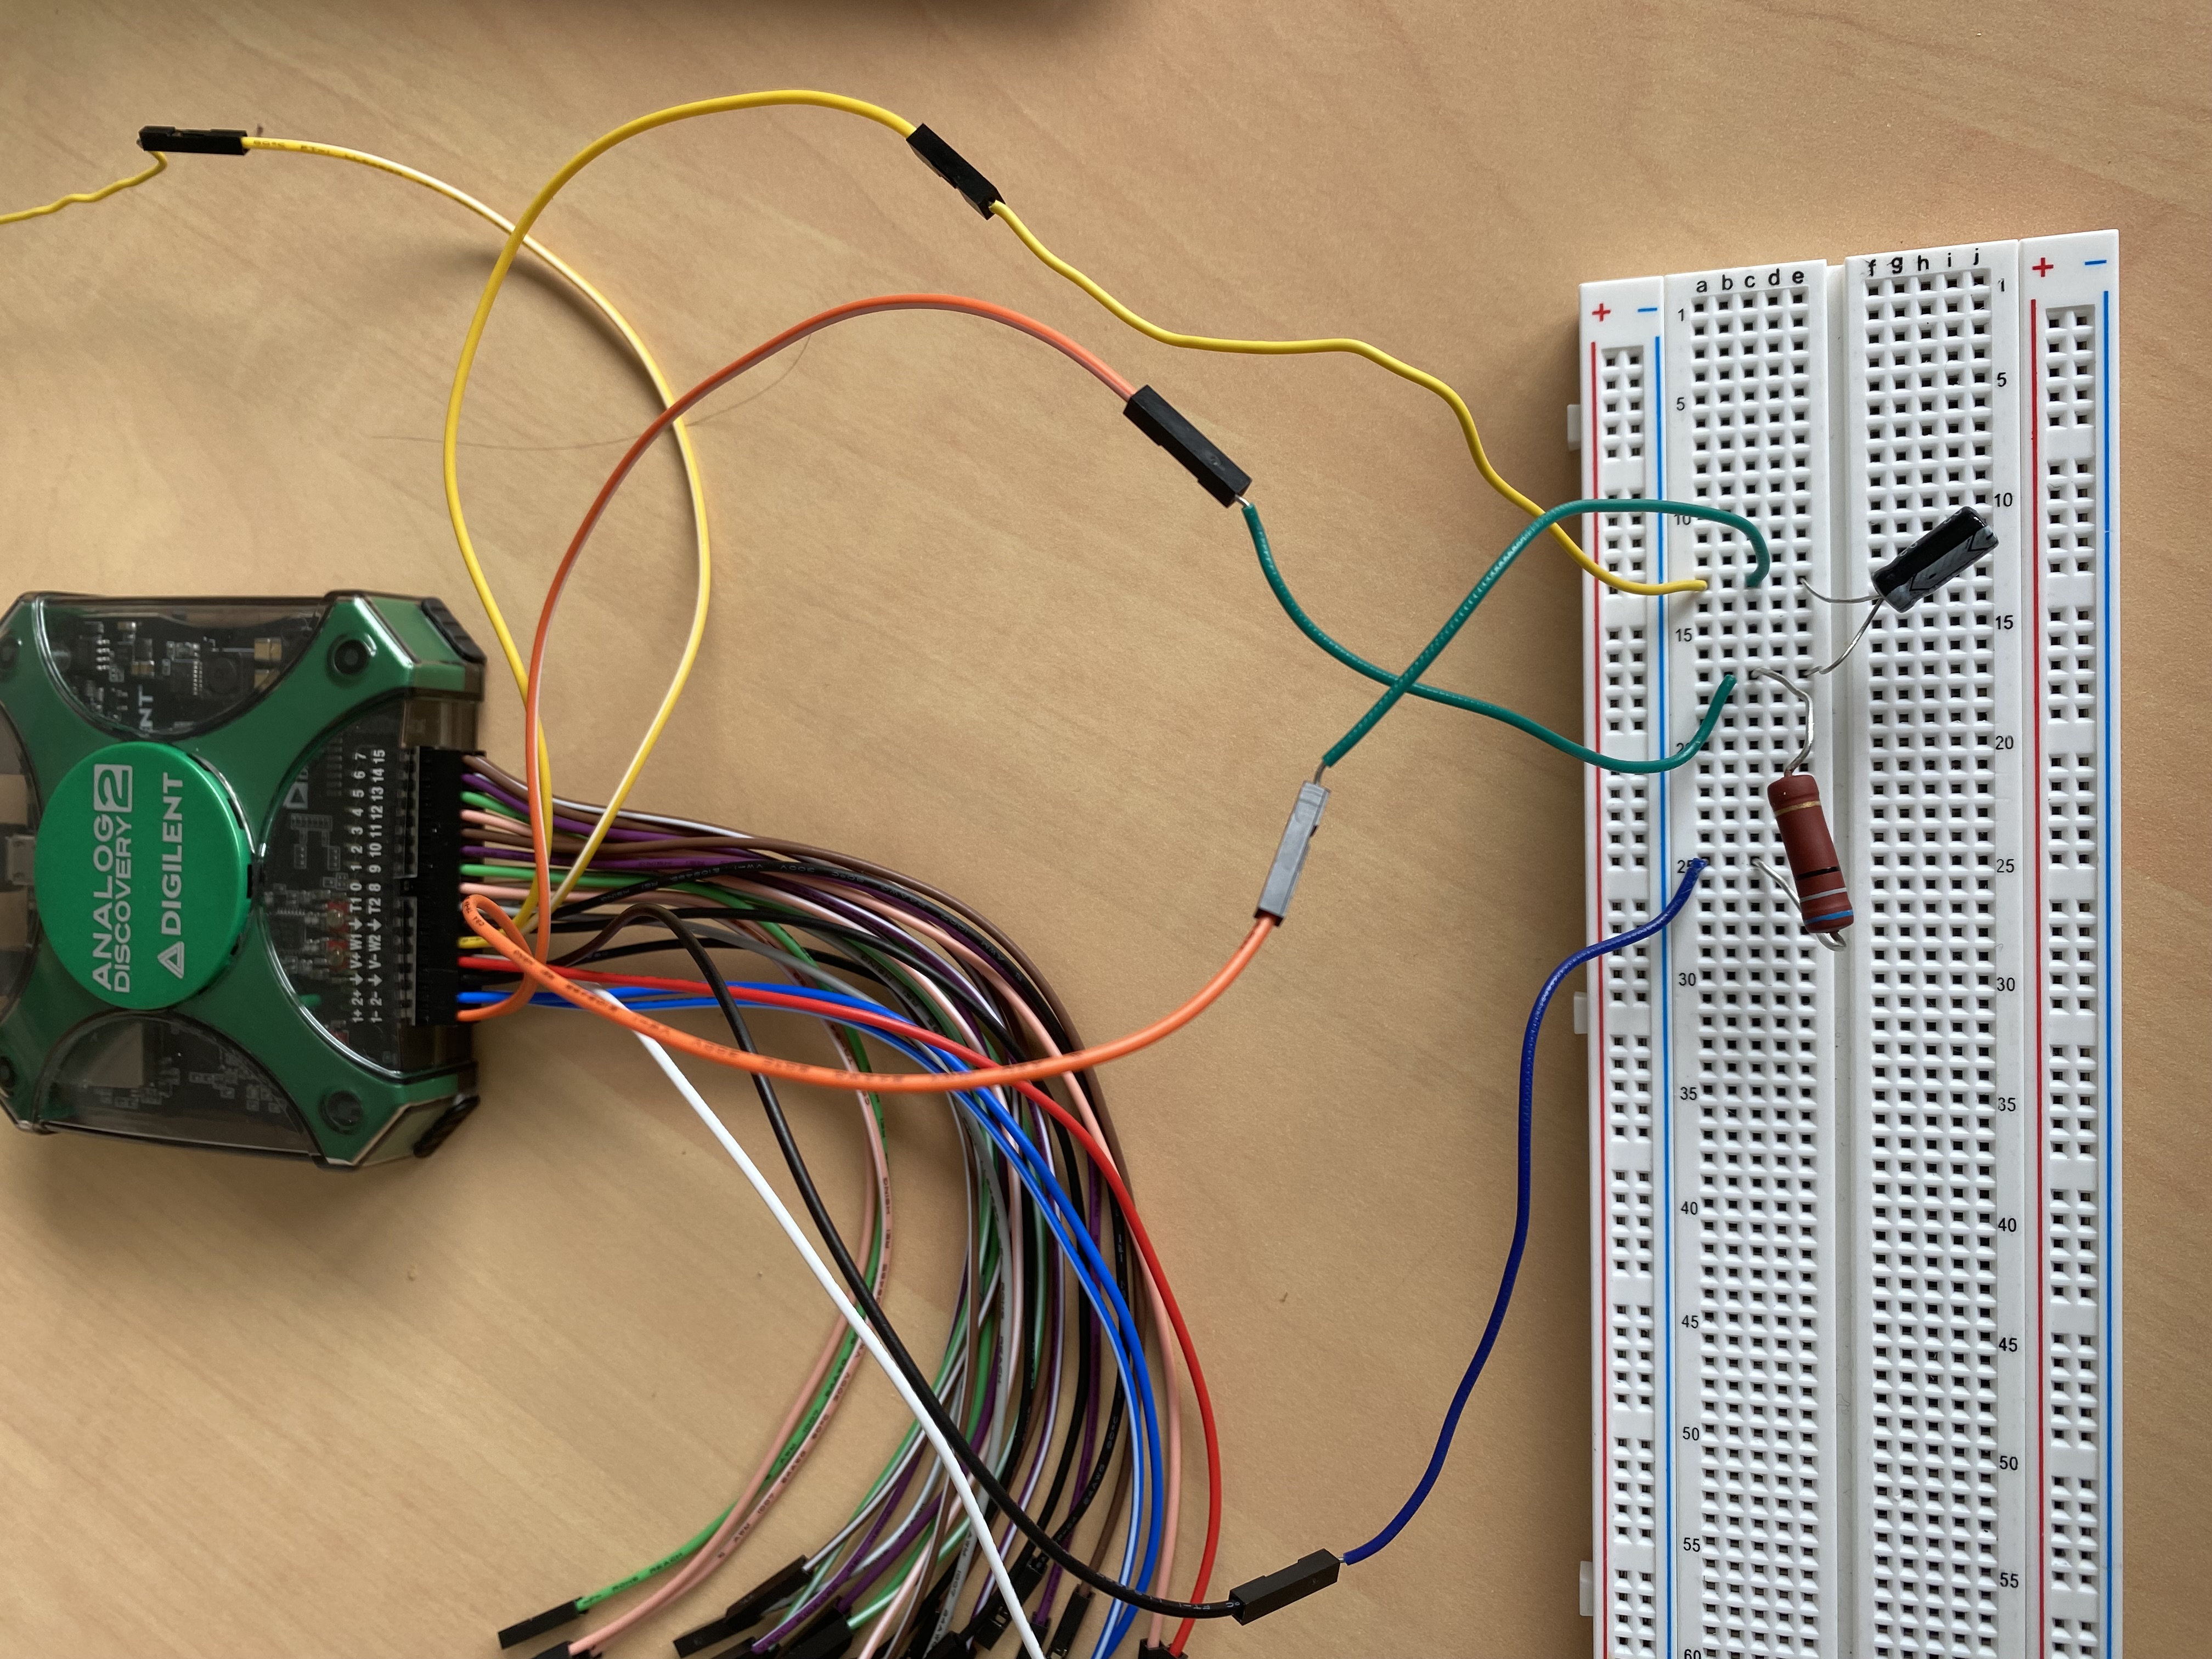
A resistor of about 1k ohms and a capacitor of about 1uF are connected to the circuit, W1 and ground are connected at both ends of the circuit and 1+ and 1- are connected at both ends of the capacitor, as shown in the following connection diagram.
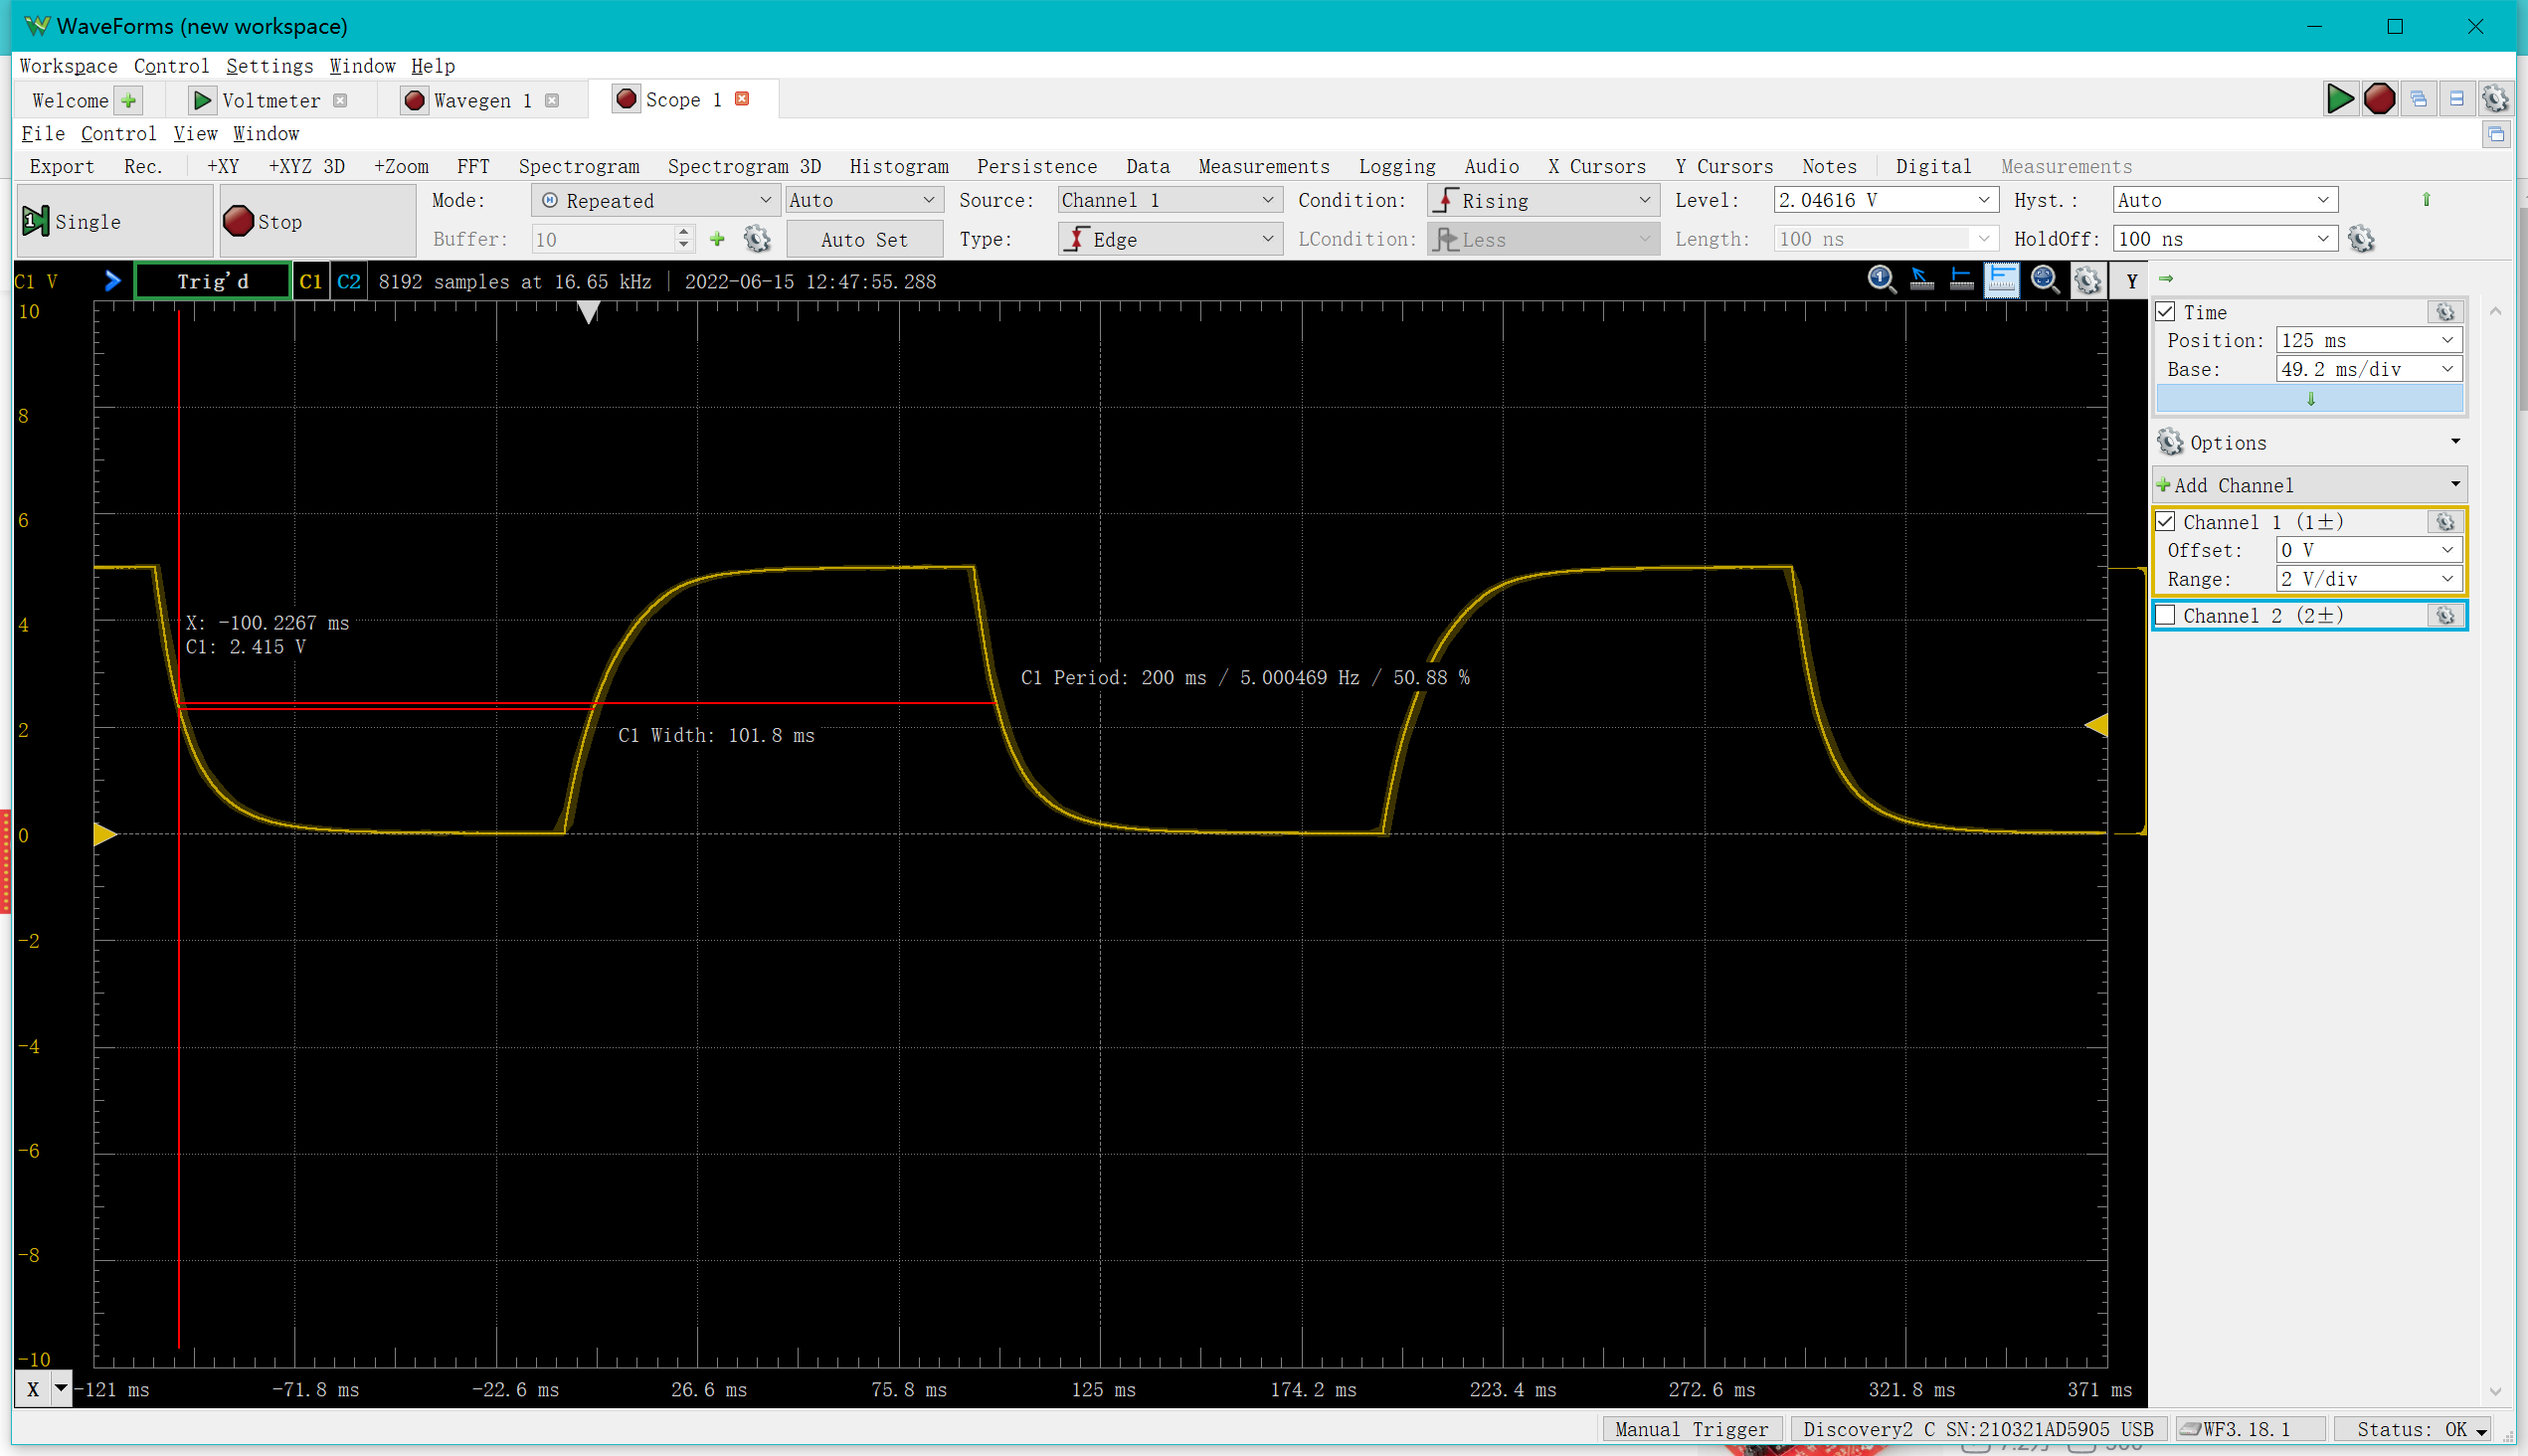
Using "wavegen" to generate a square wave with a frequency of 100Hz, an amplitude of 2.5V and a bias of 2.5V.
Click on "auto set" in the "Scope" screen to automatically adjust and then manually adjust if you are not satisfied with the graphics.
Eventually a similar waveform like this will be observed:
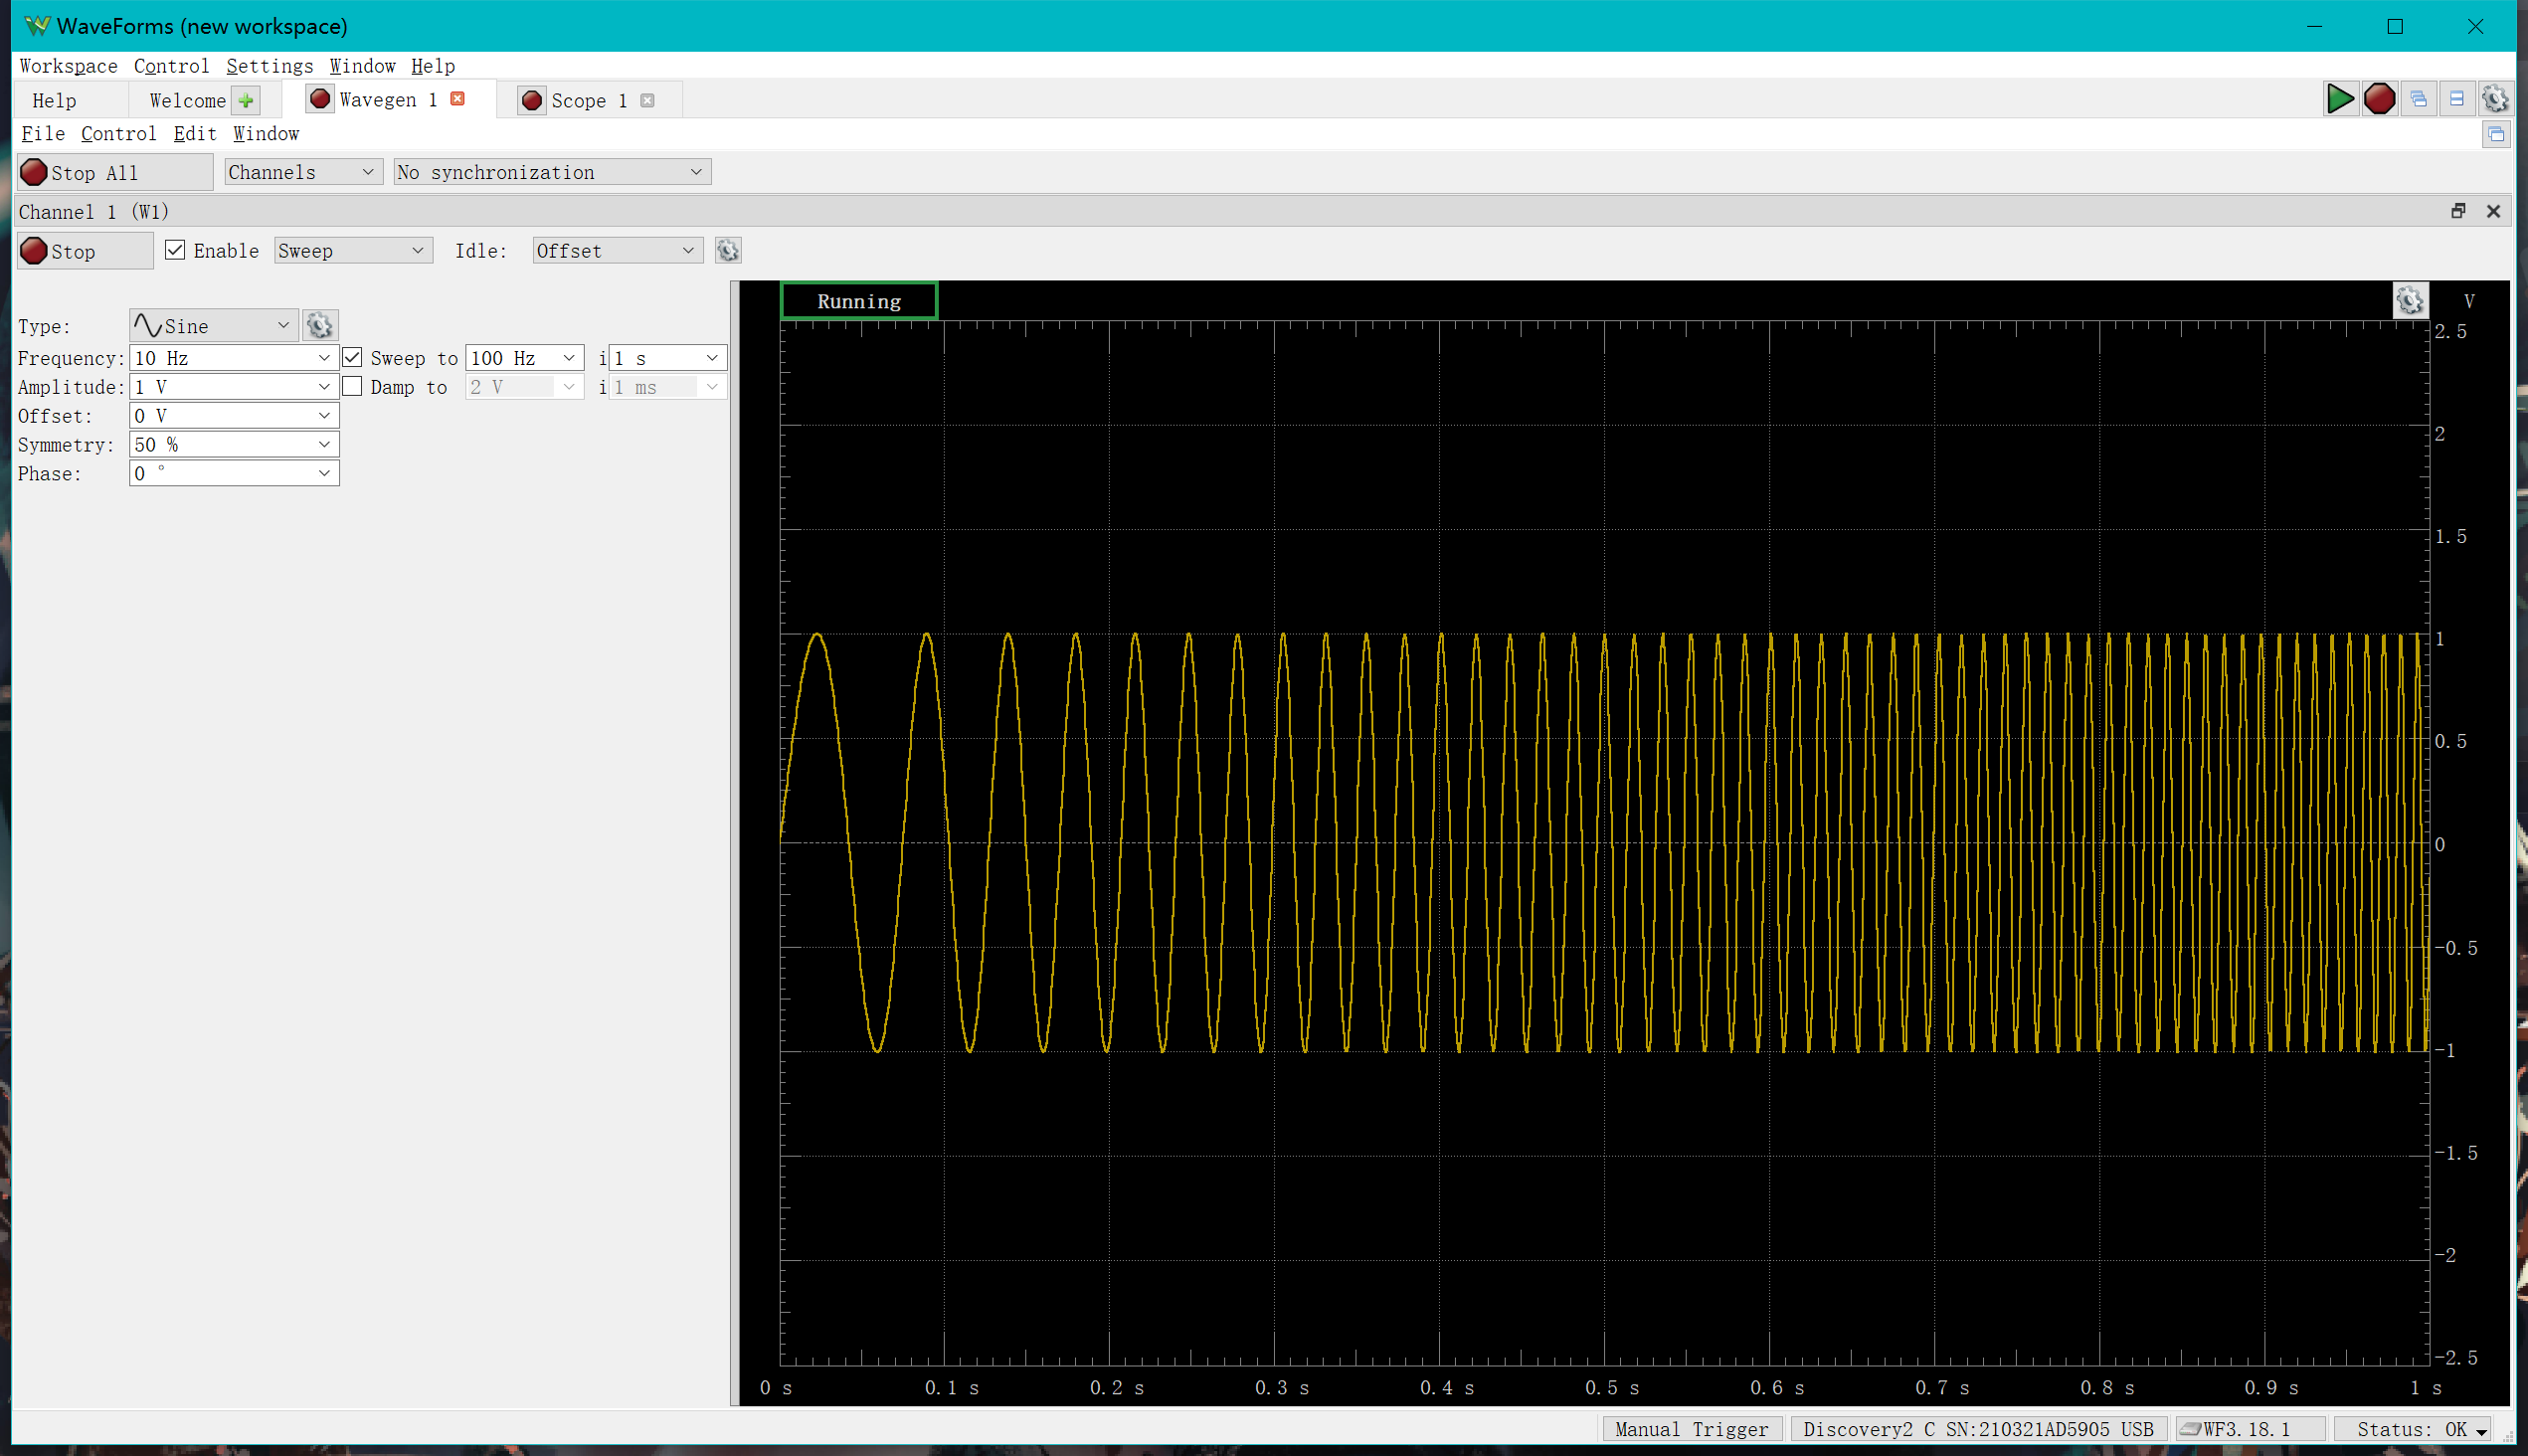
In the "wavegen" interface, we can generate more than just simple waveforms. Select "Sweep" to generate a sweep waveform, "play" to play locally imported audio, and "Custom" to use a mathematical function to generate a waveform. or import a file to customise the waveform.
Connect W1 to 1+ , ground to 1-
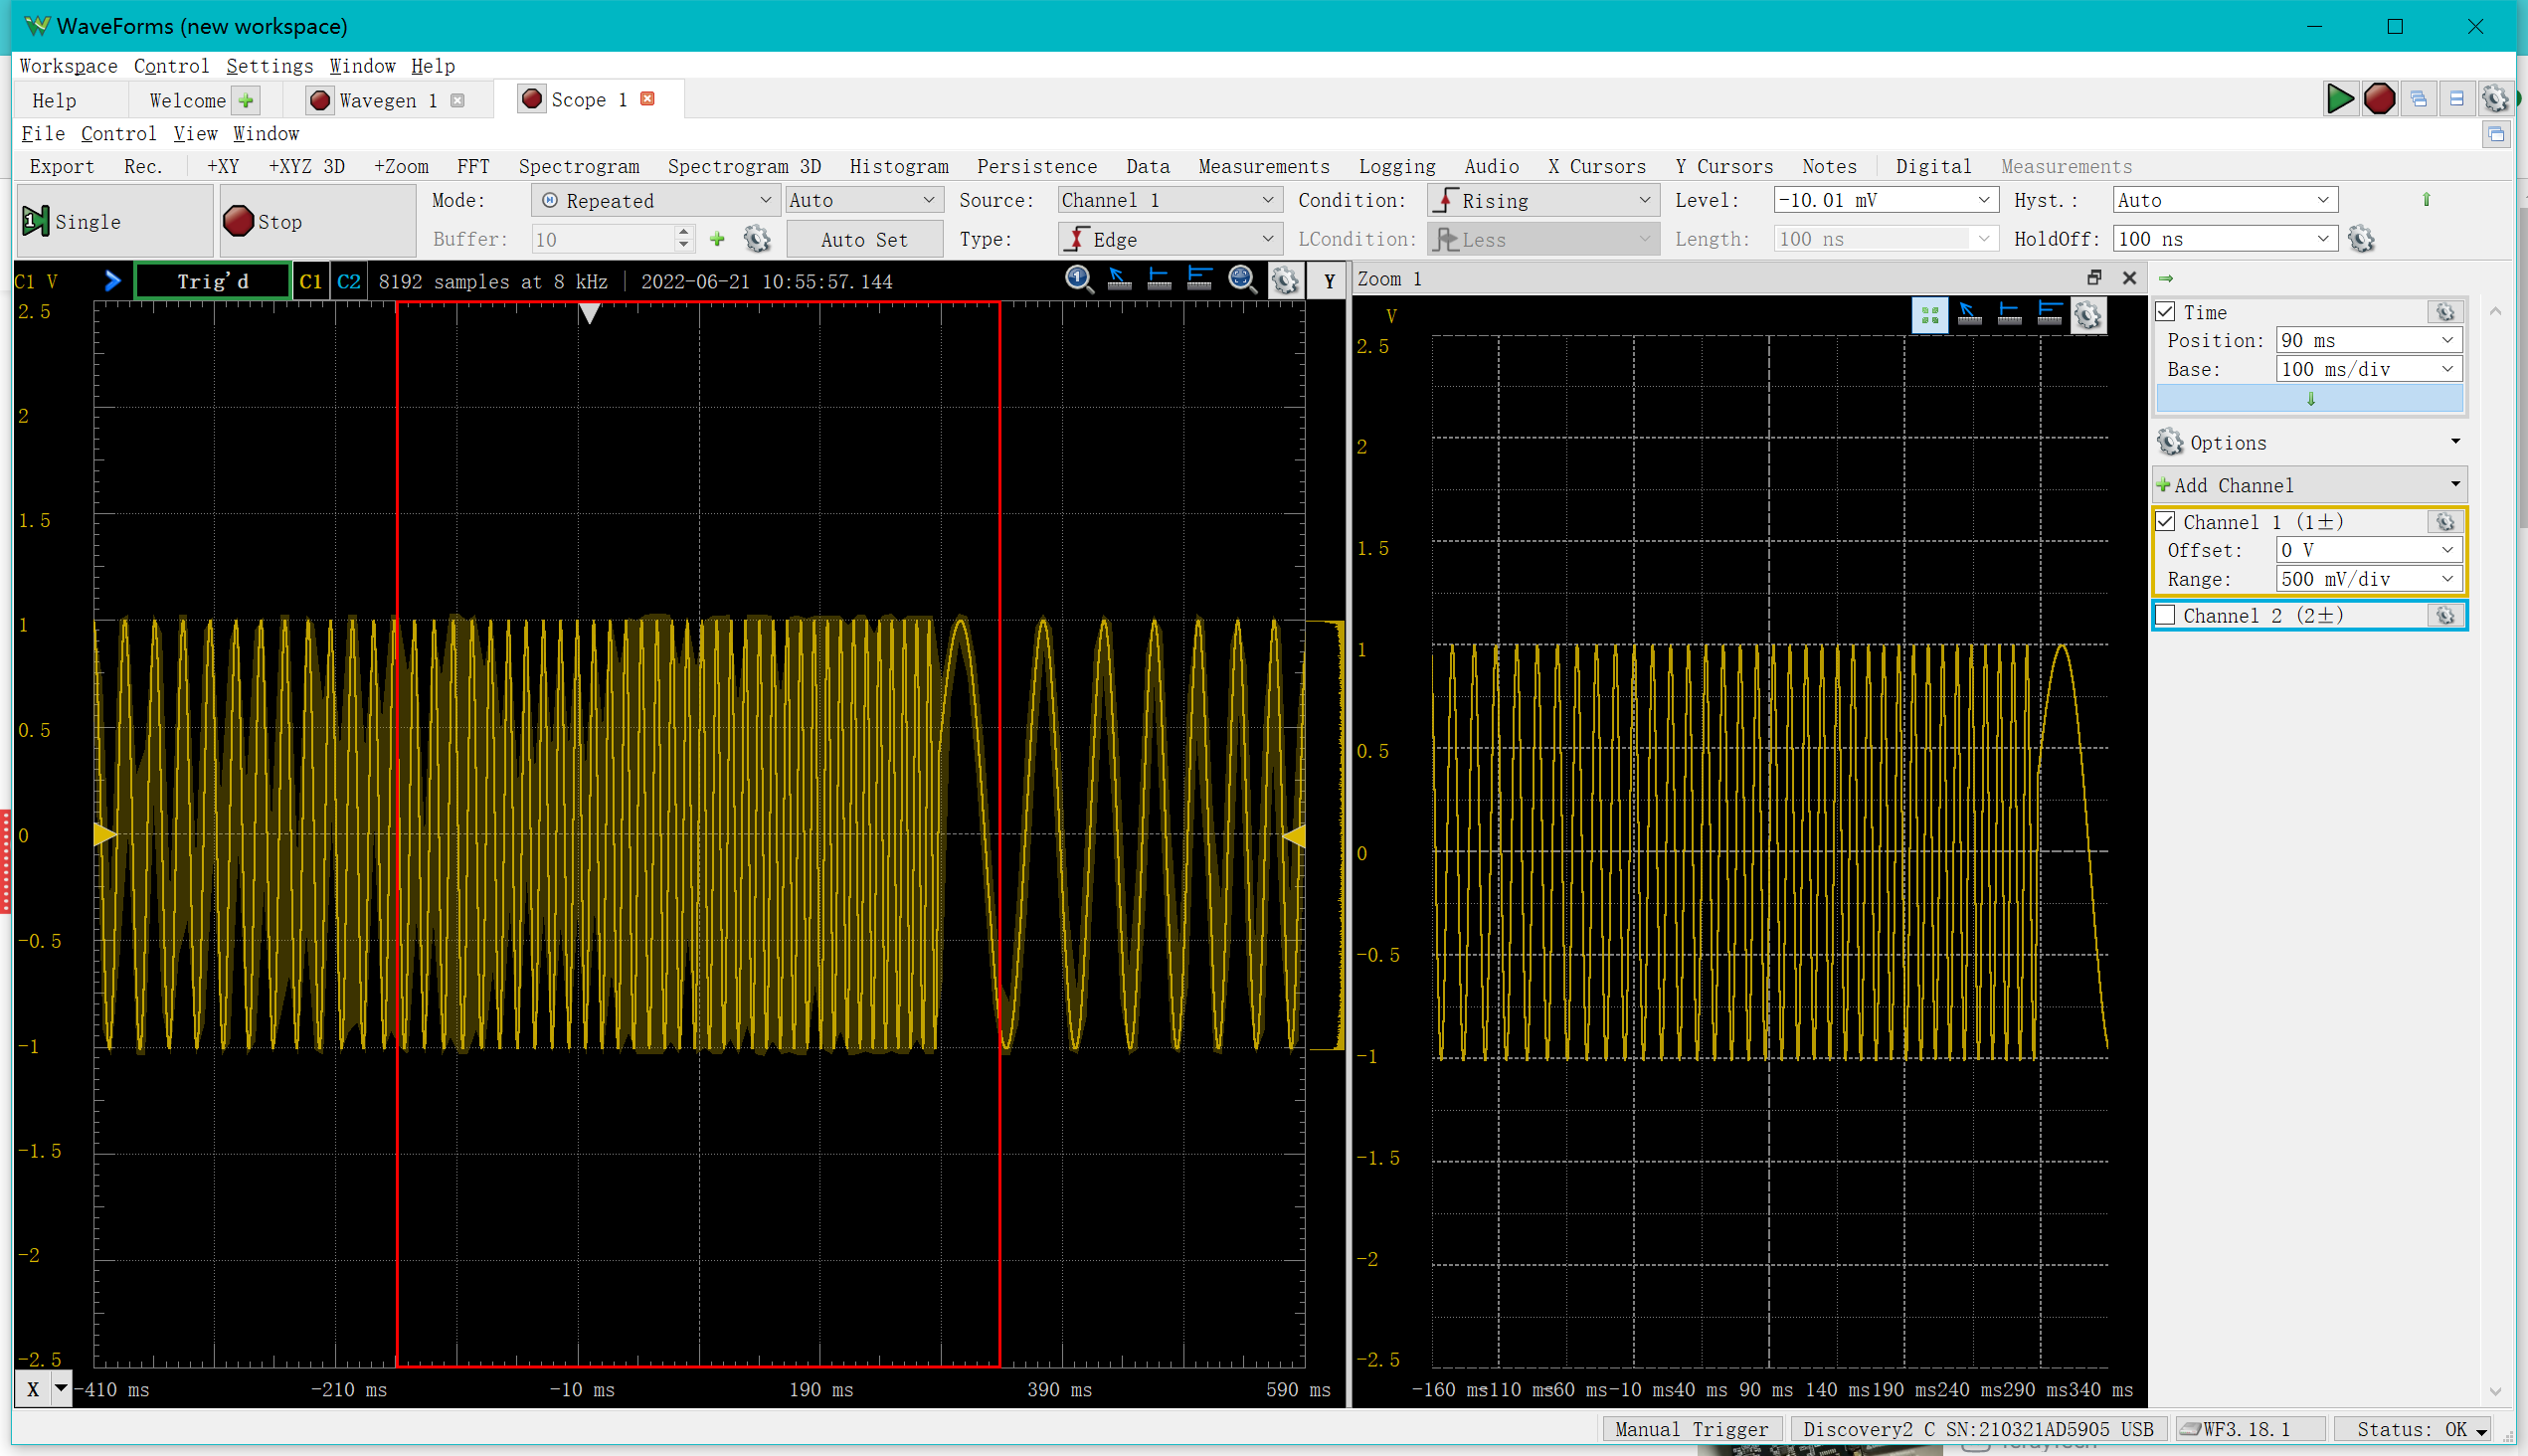
Take the sweep function as an example
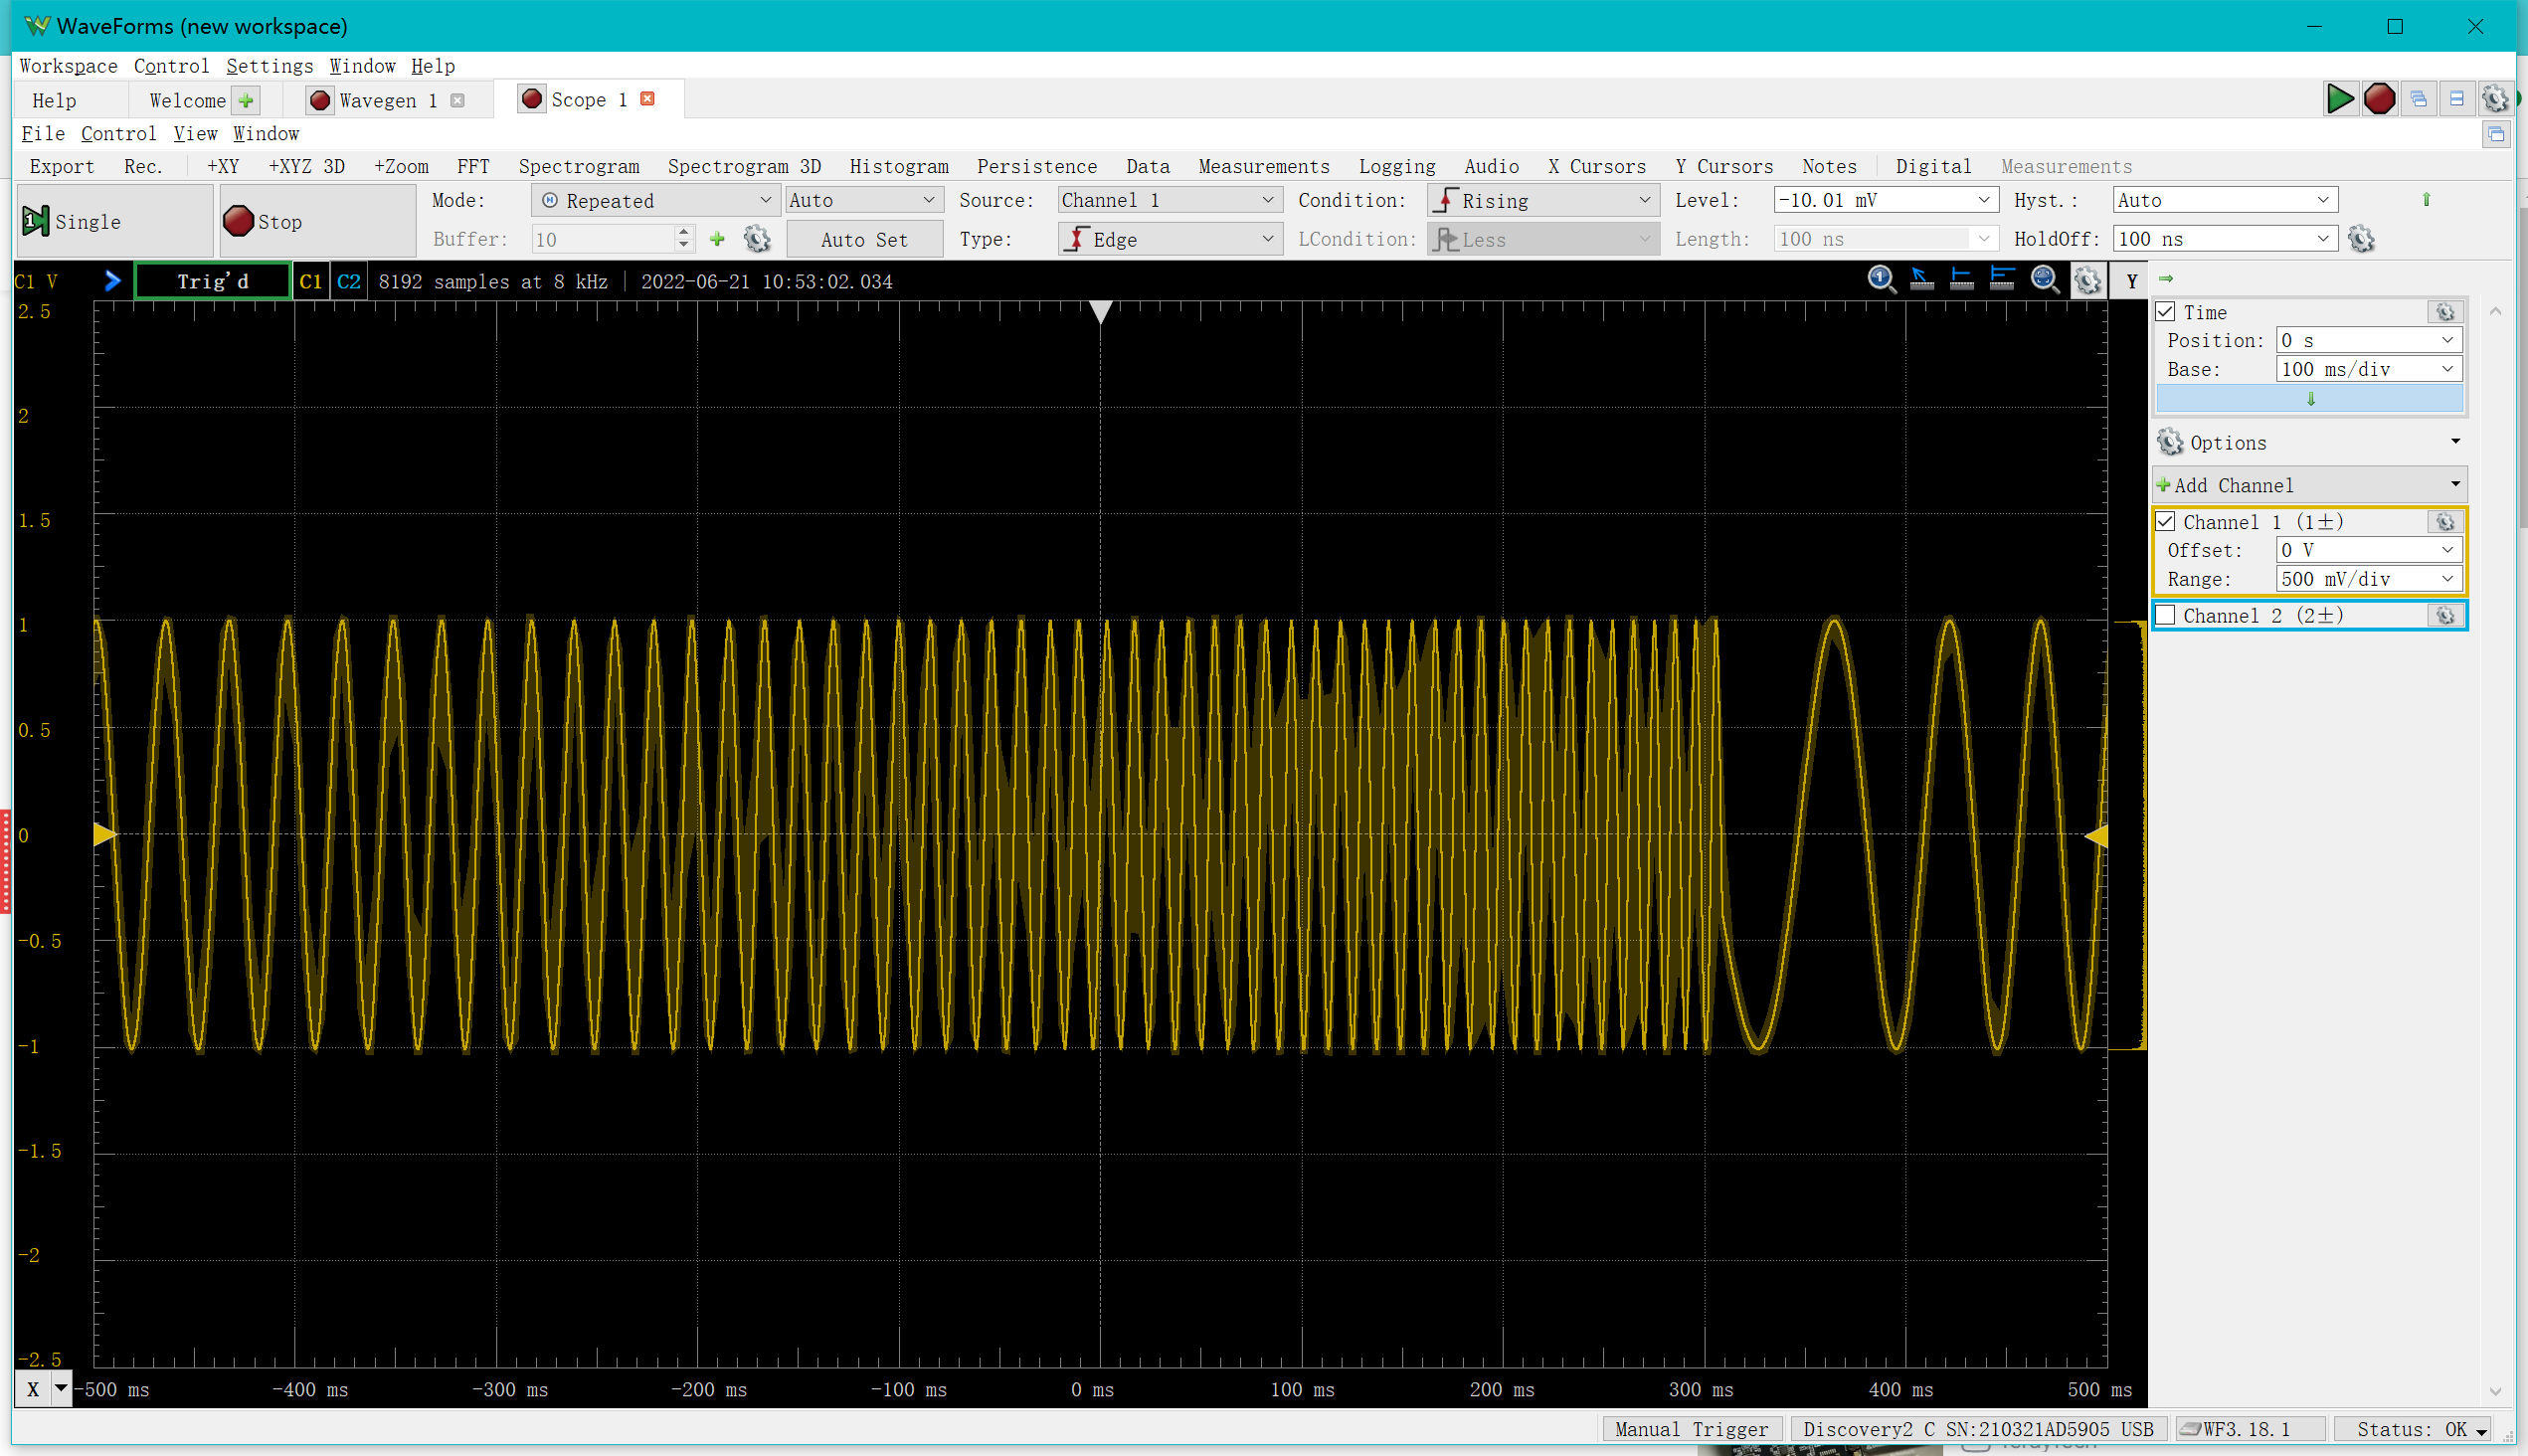
In the "Scope" the following is displayed
At this point you can select view->zoom to look at a small area in more detail
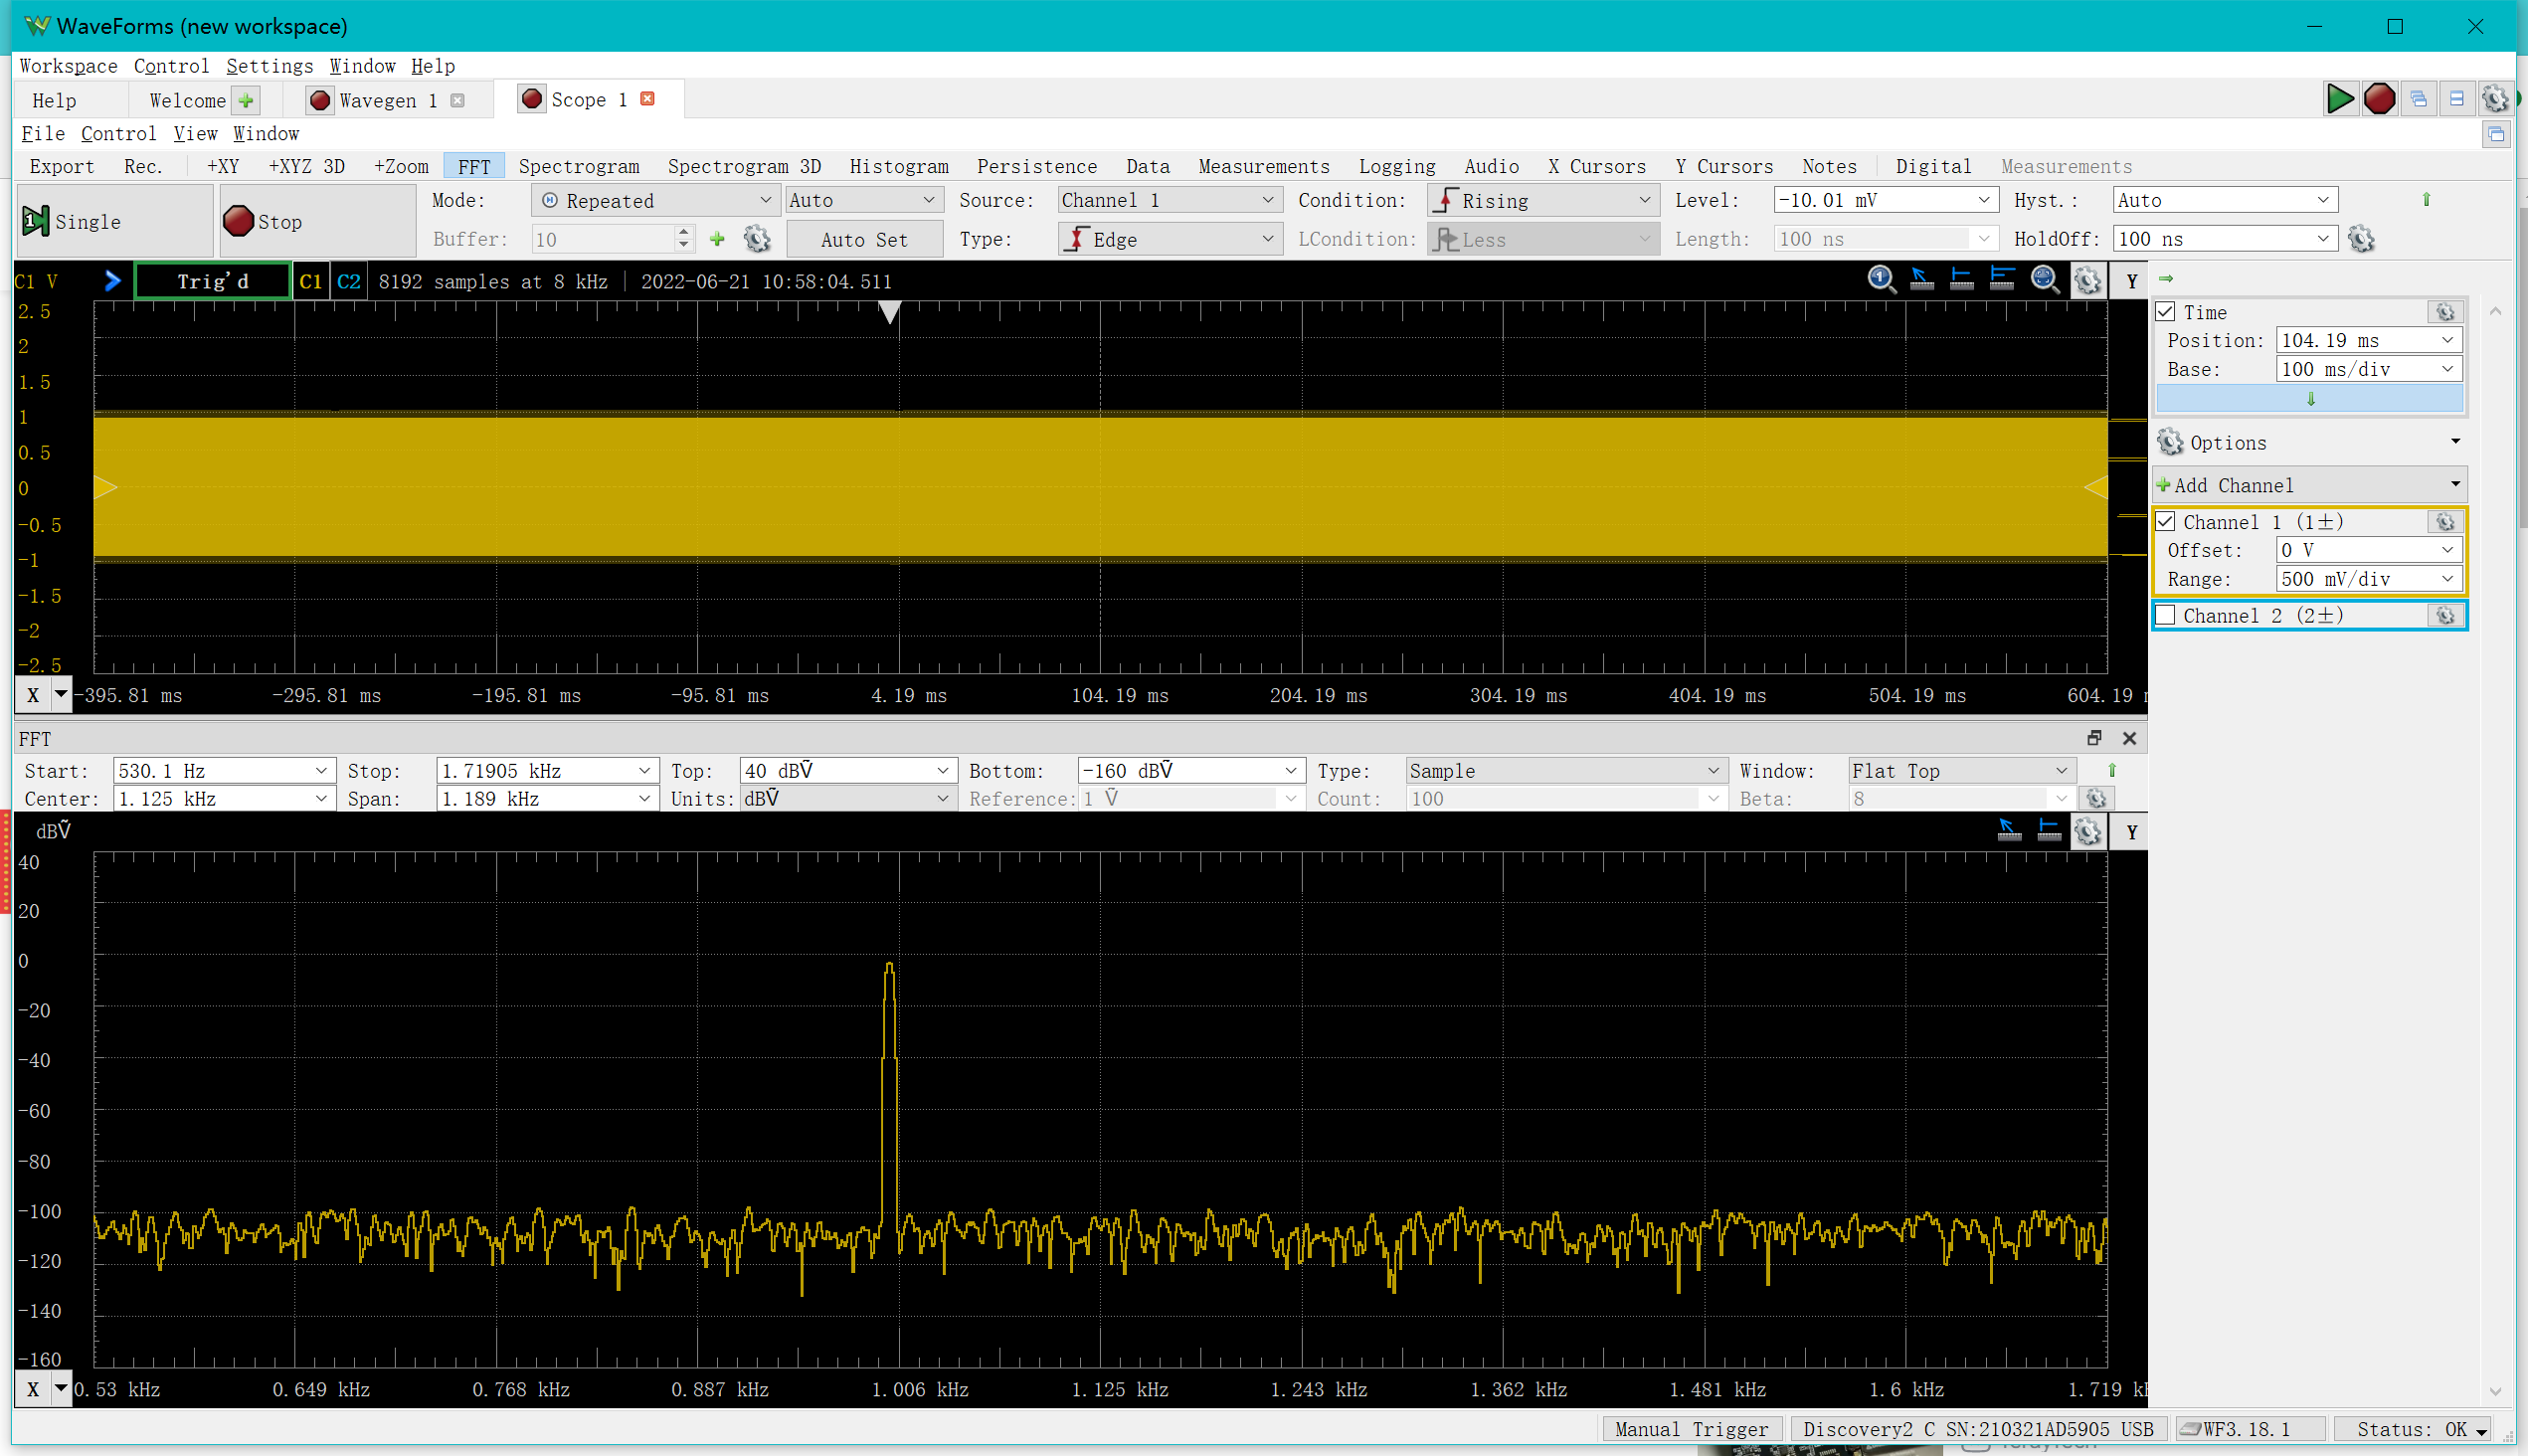
If for a 1kHz sine wave, you can select vies->FFT and be able to observe a clear bump at 1kHz
"Spectrum" is mainly used to analyse frequencies
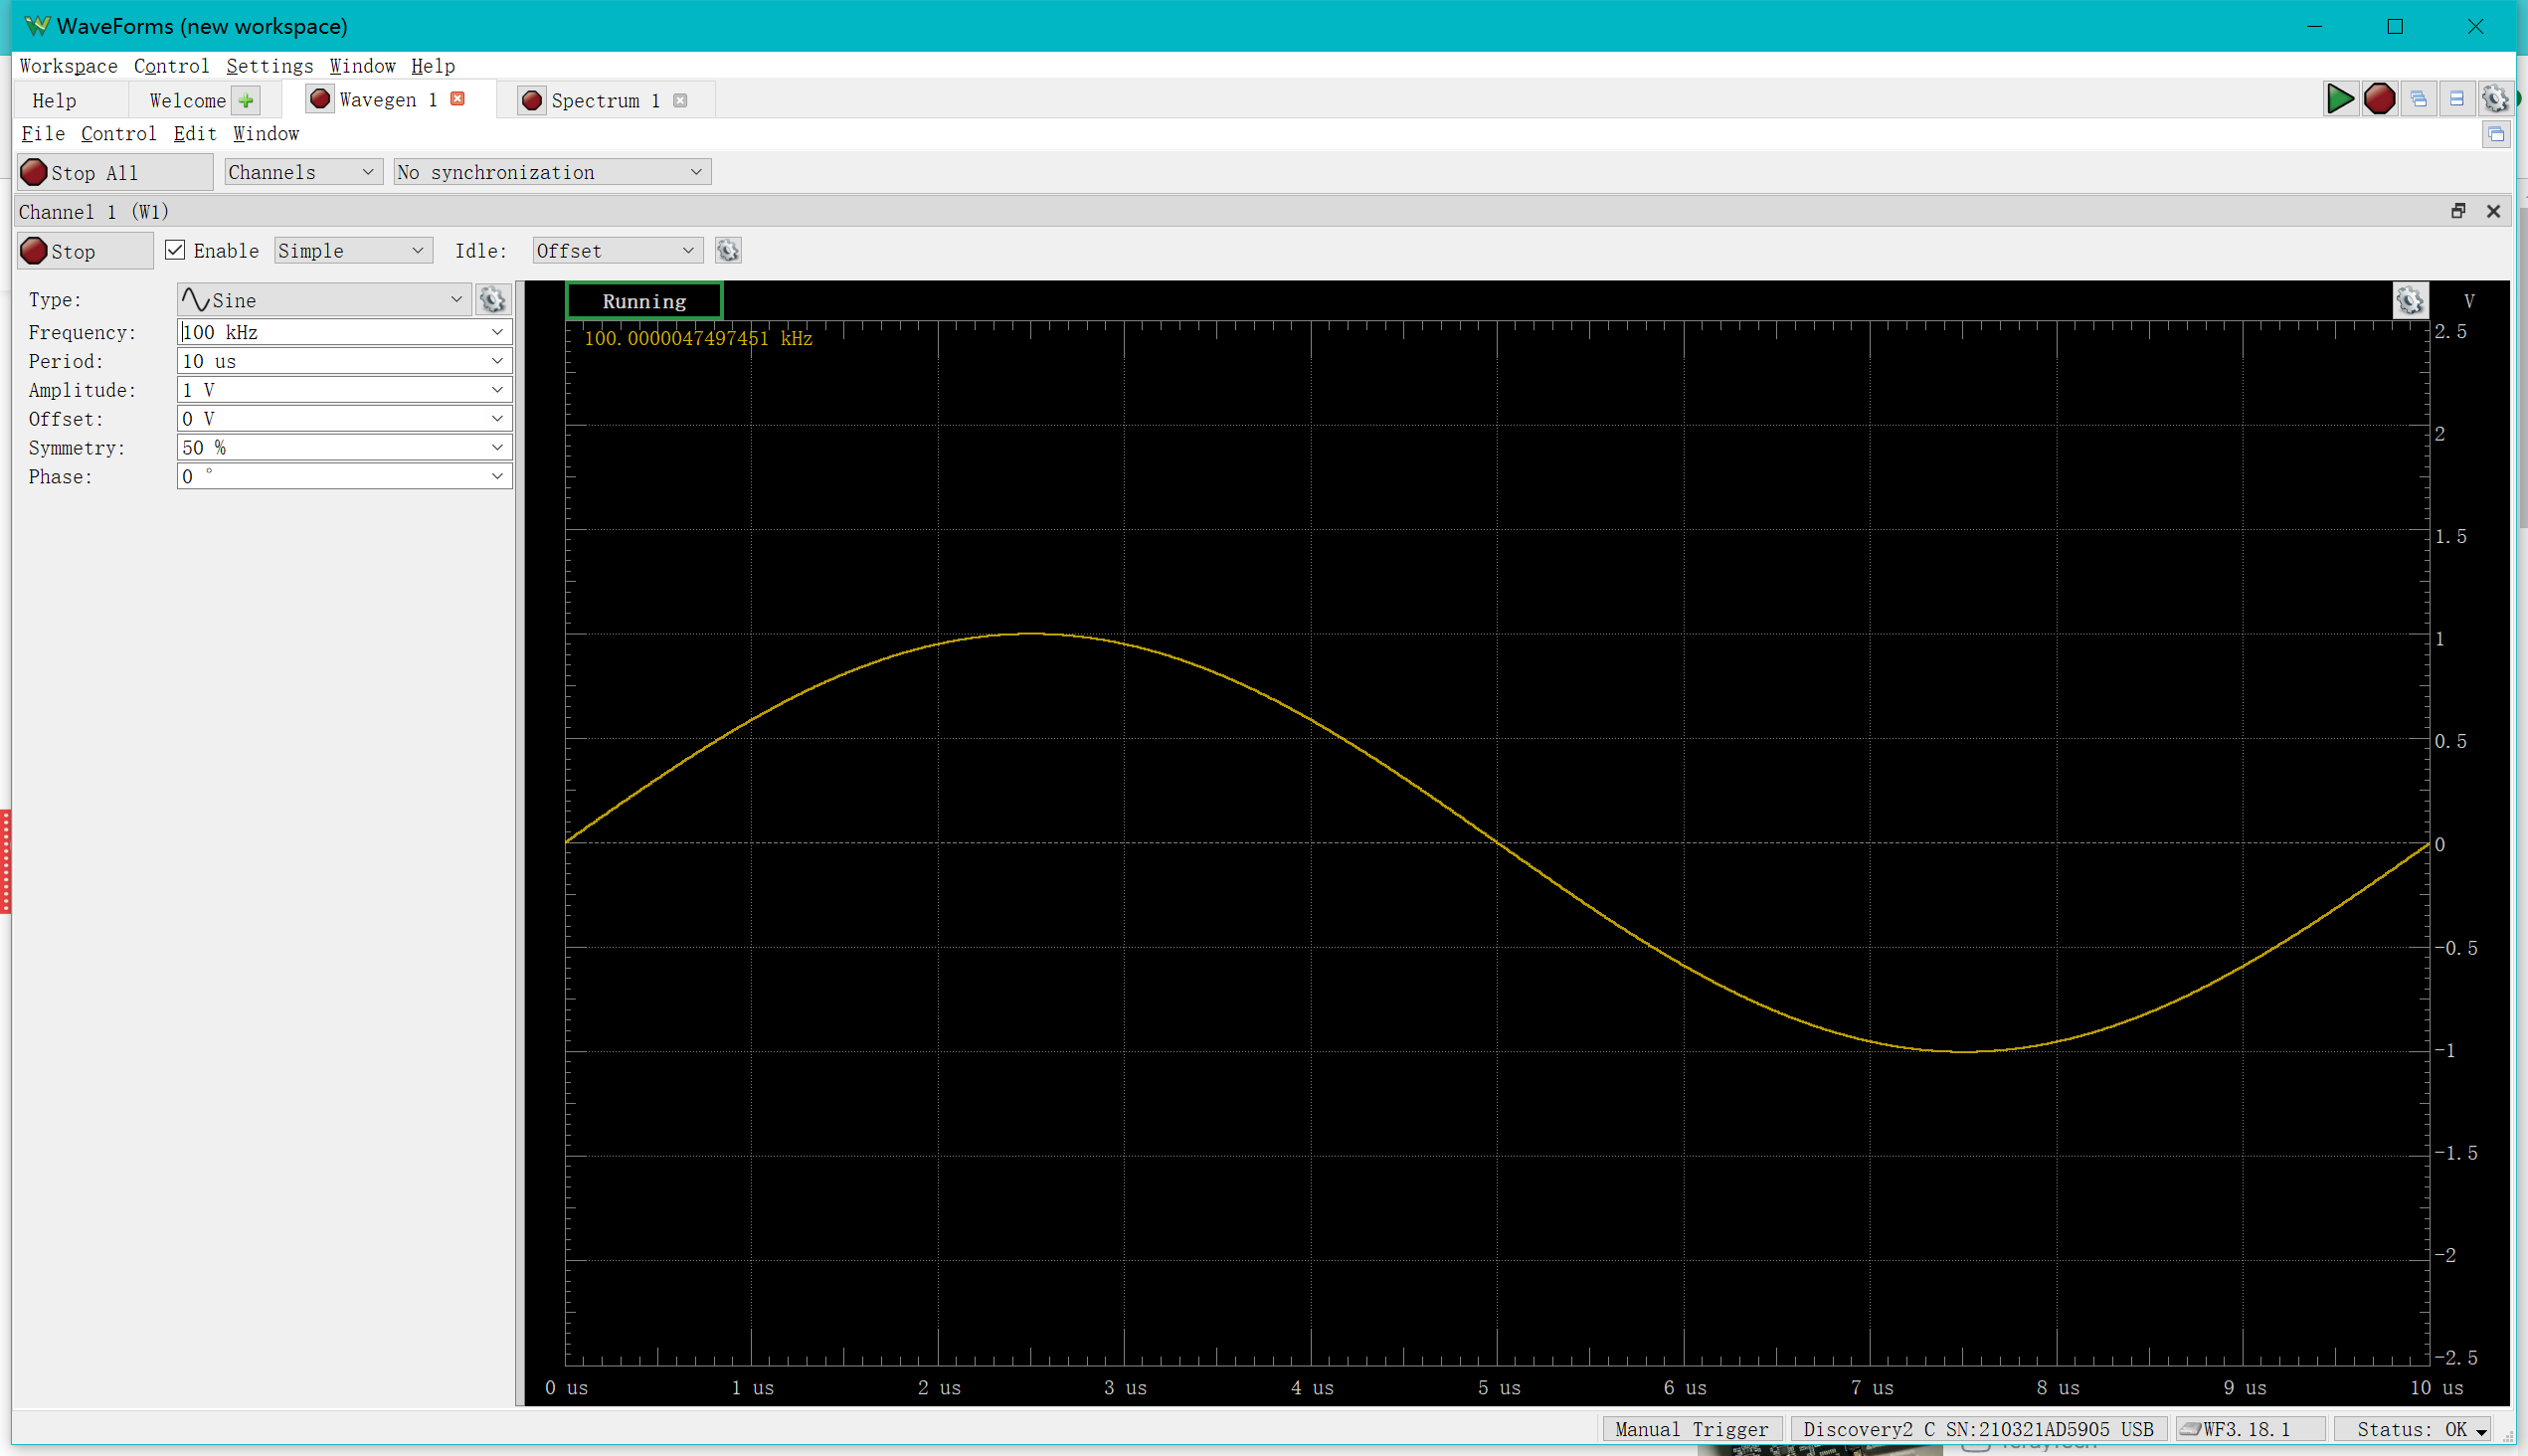
Connect W1 to 1+ , ground to 1-
A sine wave is generated as follows:
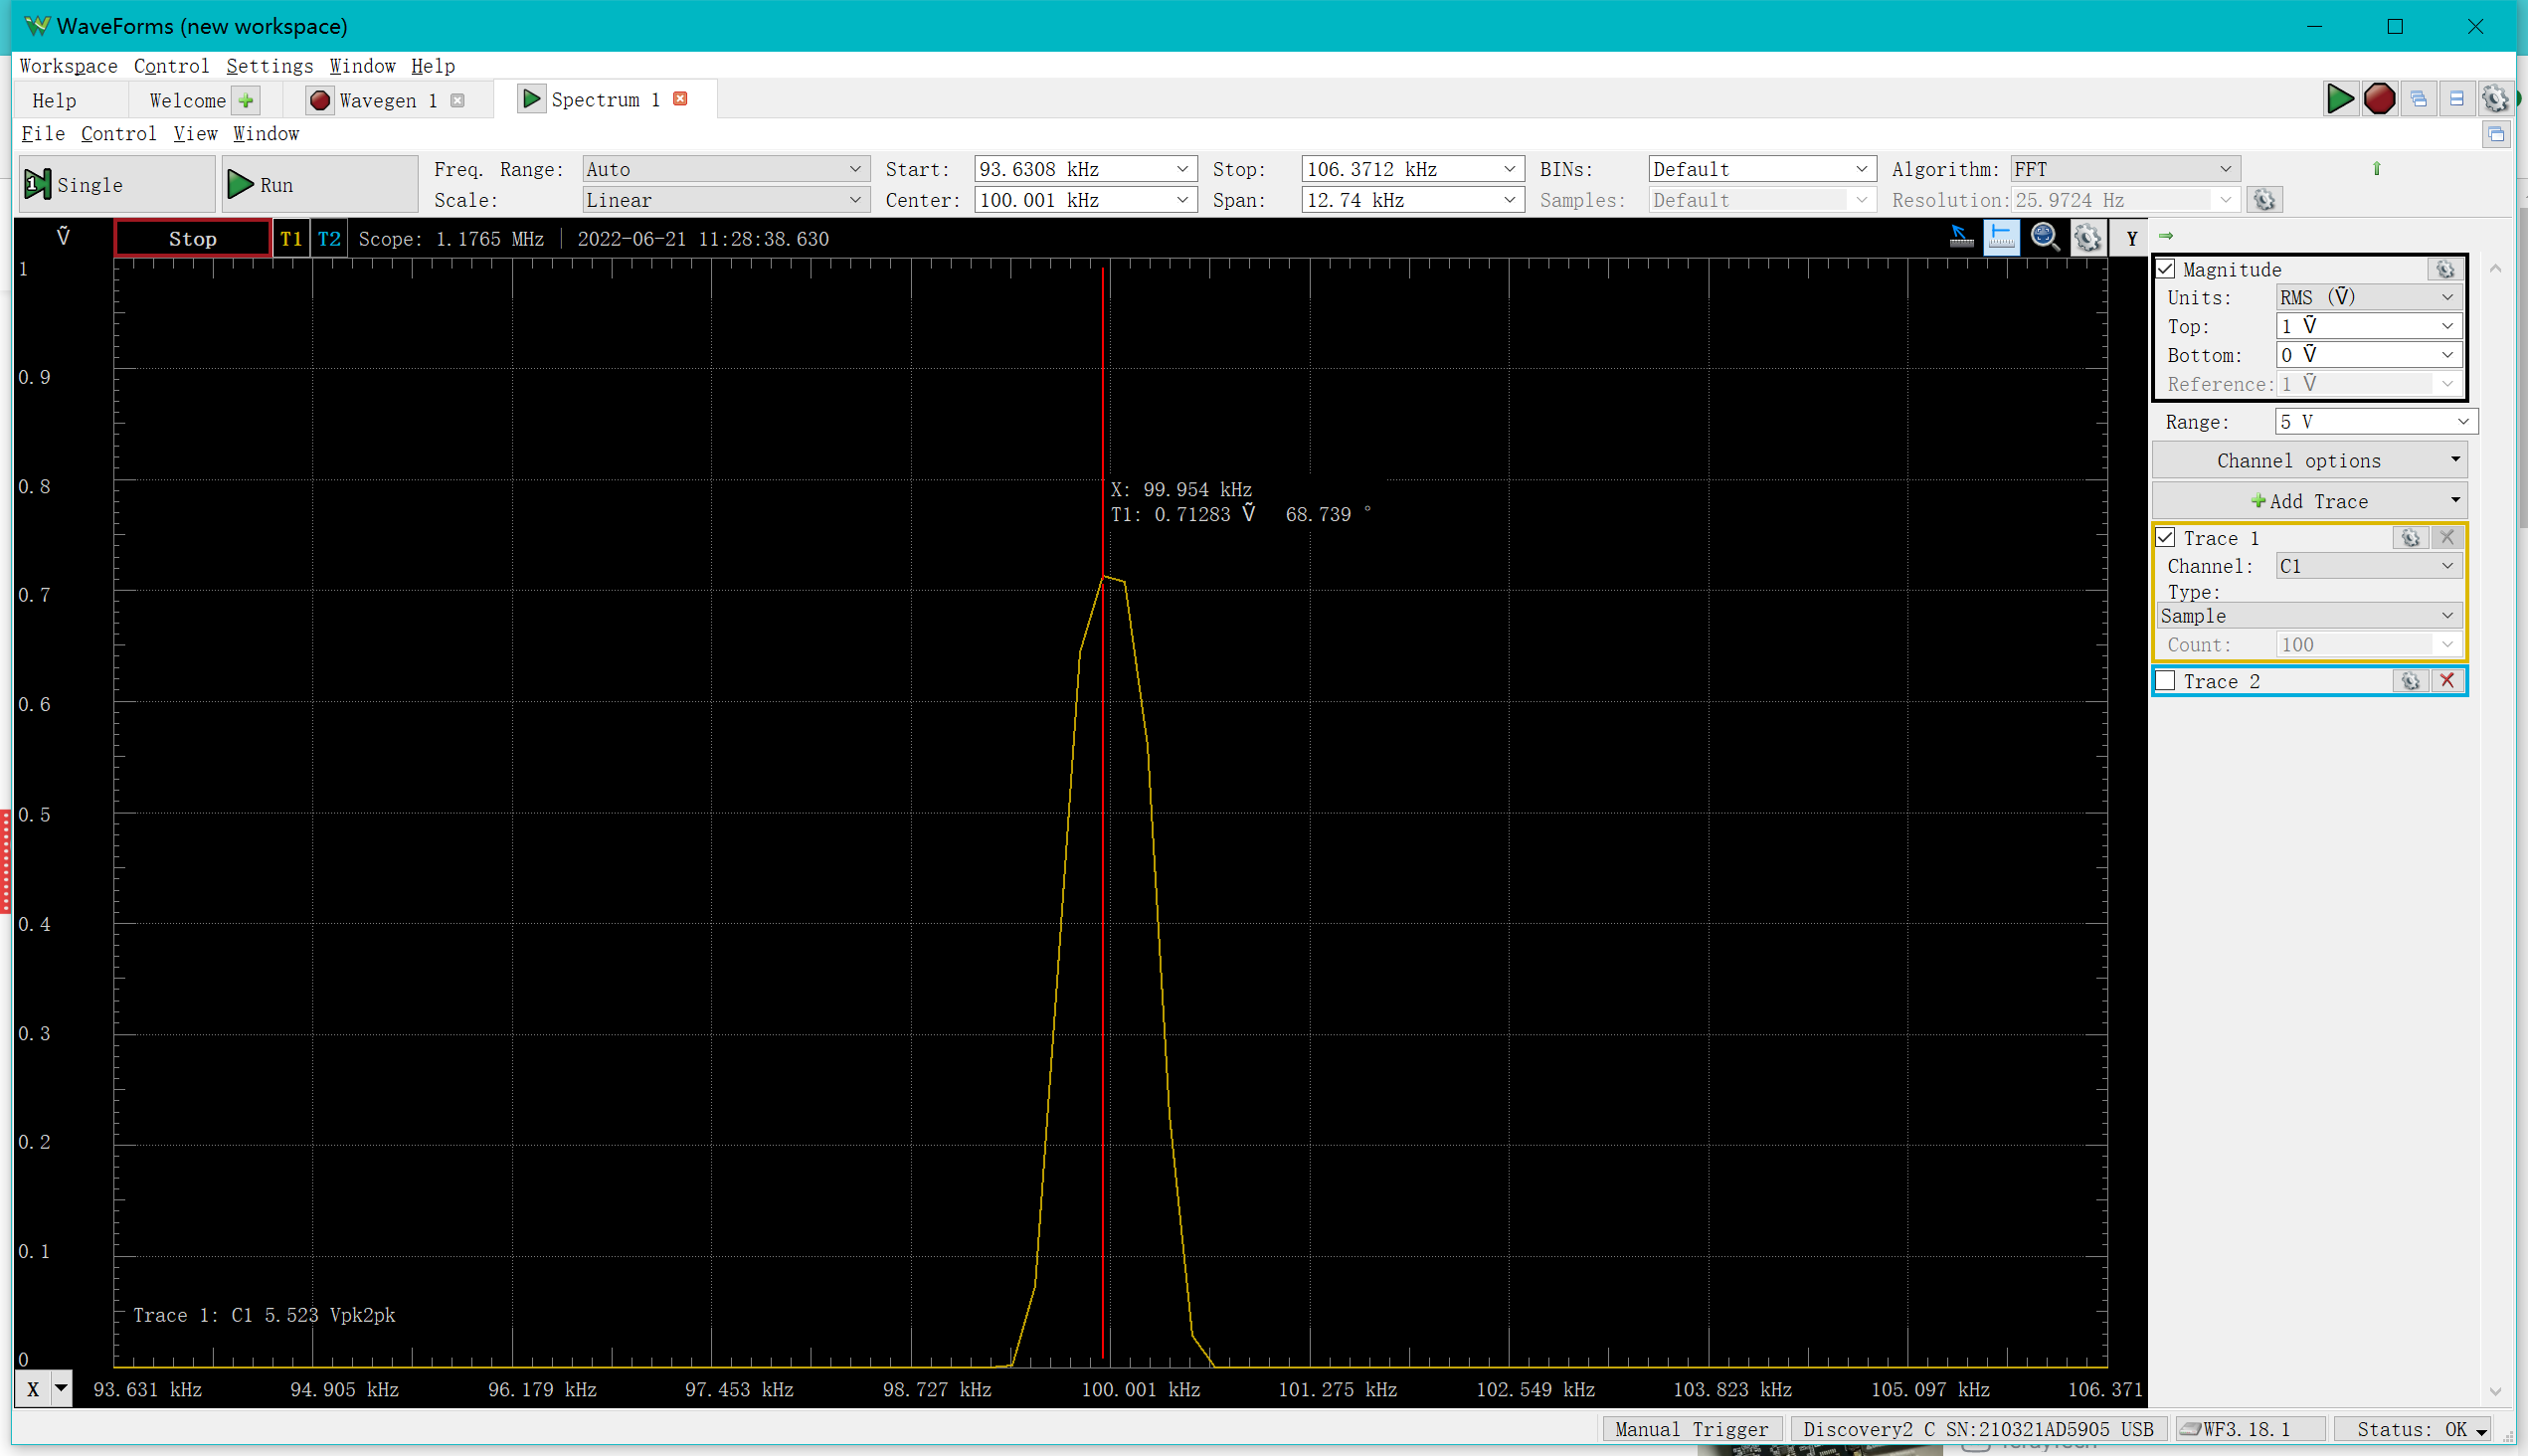
In the "Spectrum" we can observe a clear bulge at 100 kHz.
You may have noticed that the amplitude measured here is different from the amplitude of the sine wave, because the RMS value of the amplitude shown here is approximately 1/sqrt(2) of the original
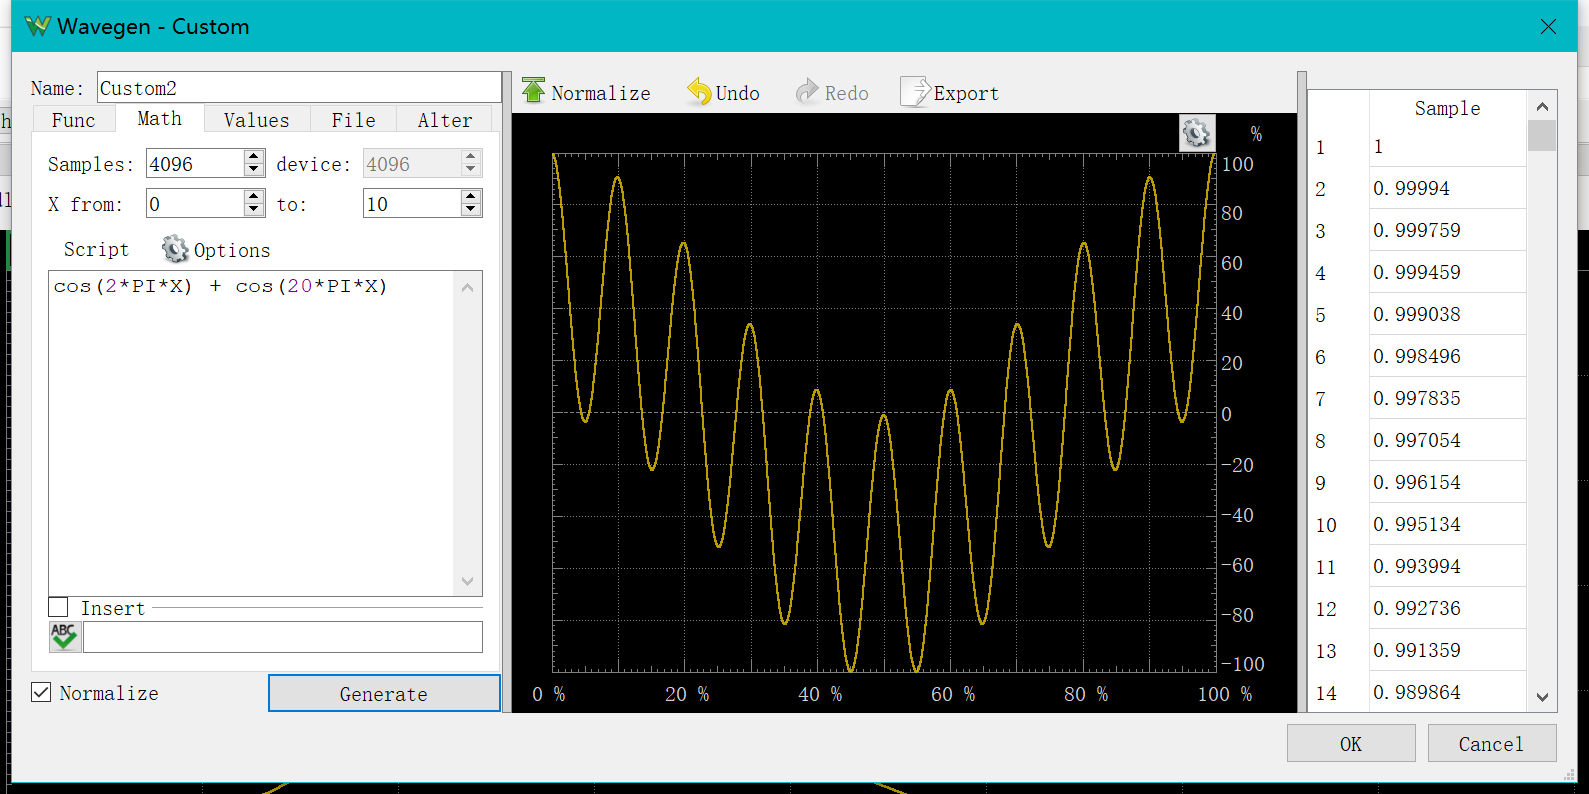
Next, we use Wavegen→Custom->math to generate a complex signal.
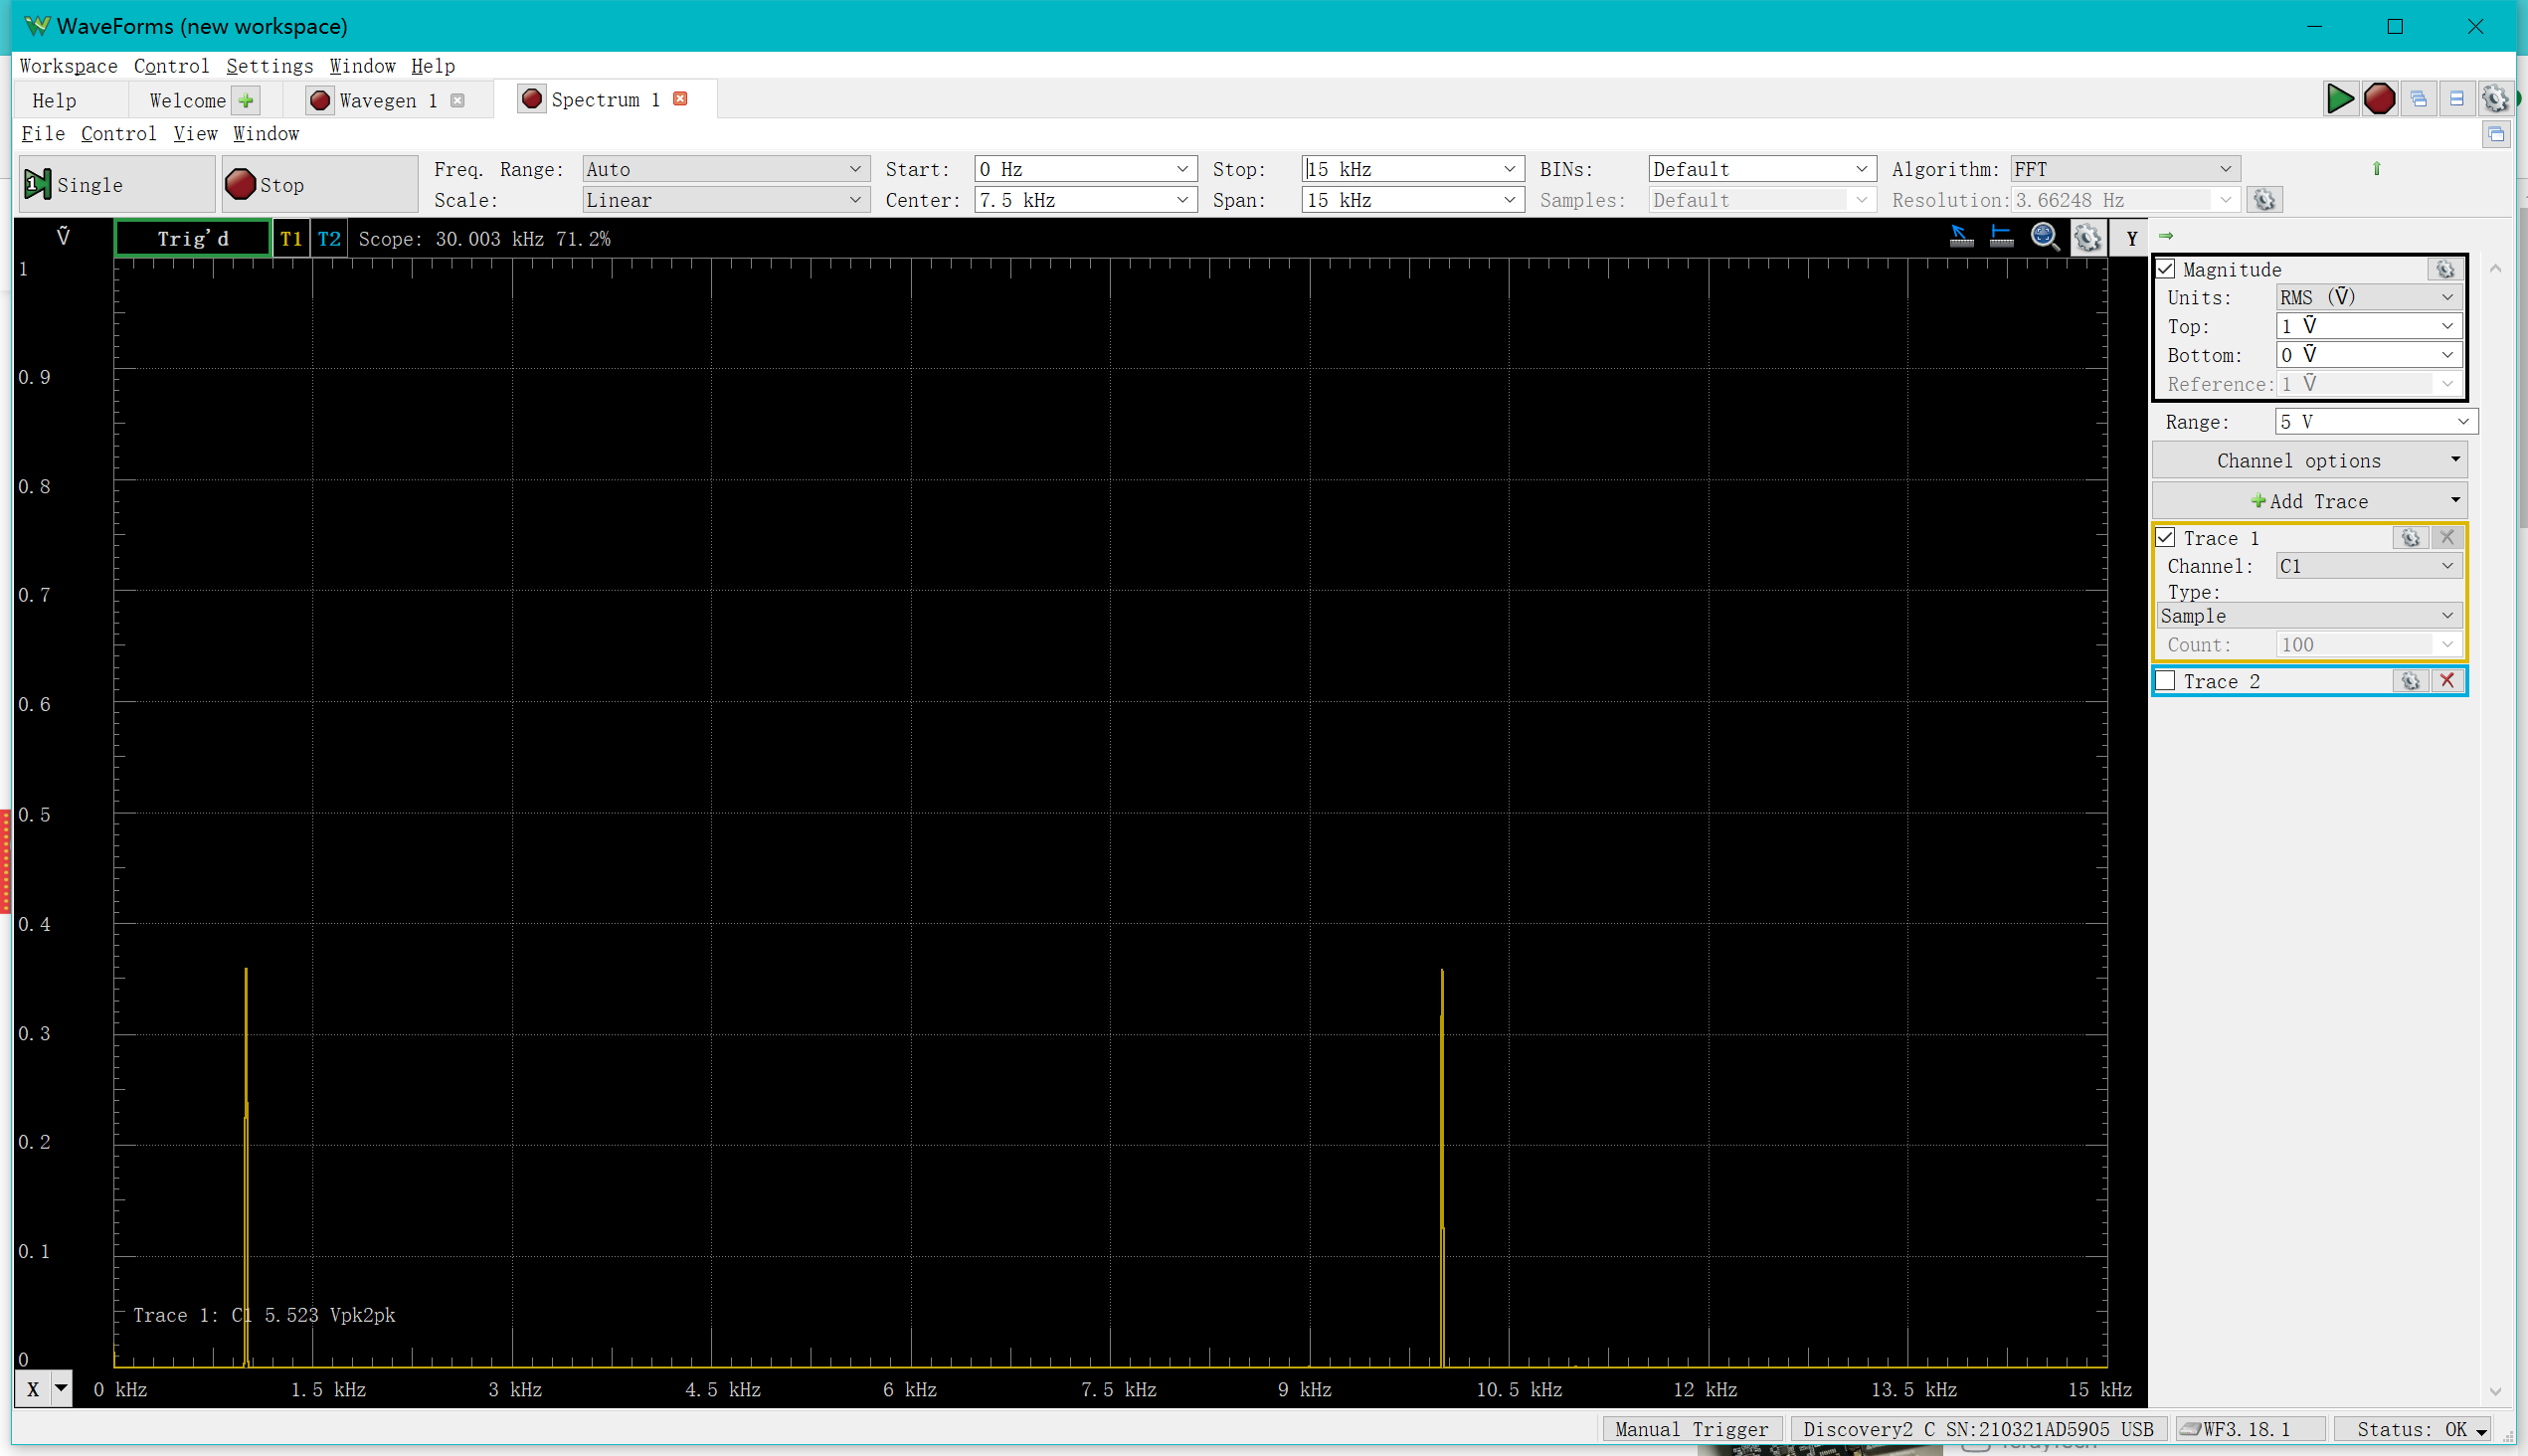
You can see that it has two main frequencies, which are then observed in the "Spectrum”
"Network" allows the analysis of amplitude and phase frequency characteristics
We now connect a capacitor into the circuit with the following wiring diagram.
The cut-off frequency can then be easily observed in the "Network".
Overall, the AD2 is a very powerful signal generator and observer that when used proficiently can be of great help in future research.


