This project sets up a collaborative environment for data scientists to have readily available resources and dependencies to work with relevant data for COVID-19 cases. In this repository, there are three data sources currently available:
- John Hopkins University CSSE (JHU CSSE): timeseries data that tracks confirmed,recovered, and diseased cases of COVID-19.
- The data is directly fetched raw from JHU's repository: https://github.com/CSSEGISandData/COVID-19.
- Refinitiv (Thomson Reuters Eikon): news headlines and news articles for COVID-19 from Eikon's API.
- Twitter: tweets from a selected number of users as an alternative source of news for COVID-19 from Twitter's API.
To test our data sources, we introduce the SEIR epidemologist model and create an API with Flask to output data about the estimates that the model calculates.
To collaborate in this project, first clone the following URL: https://github.com/Gustrigos/Antivirus.git.
Add the following in terminal or cmd.
git clone https://github.com/Gustrigos/Antivirus.git.This project works with Python 3.7 or later.
To start, create a virtual environment, activate it, and install all the dependencies needed for this project.
python3 -m venv env
source ./env/bin/activate
pip3 install -r requirements.txtData/JHU/fetch_data.py gets timeseries data for confirmed, death, and recovered cases directly from JHU CSSE's COVID-19 repository in raw csv format. It then stores each list into a pandas dataframe object.
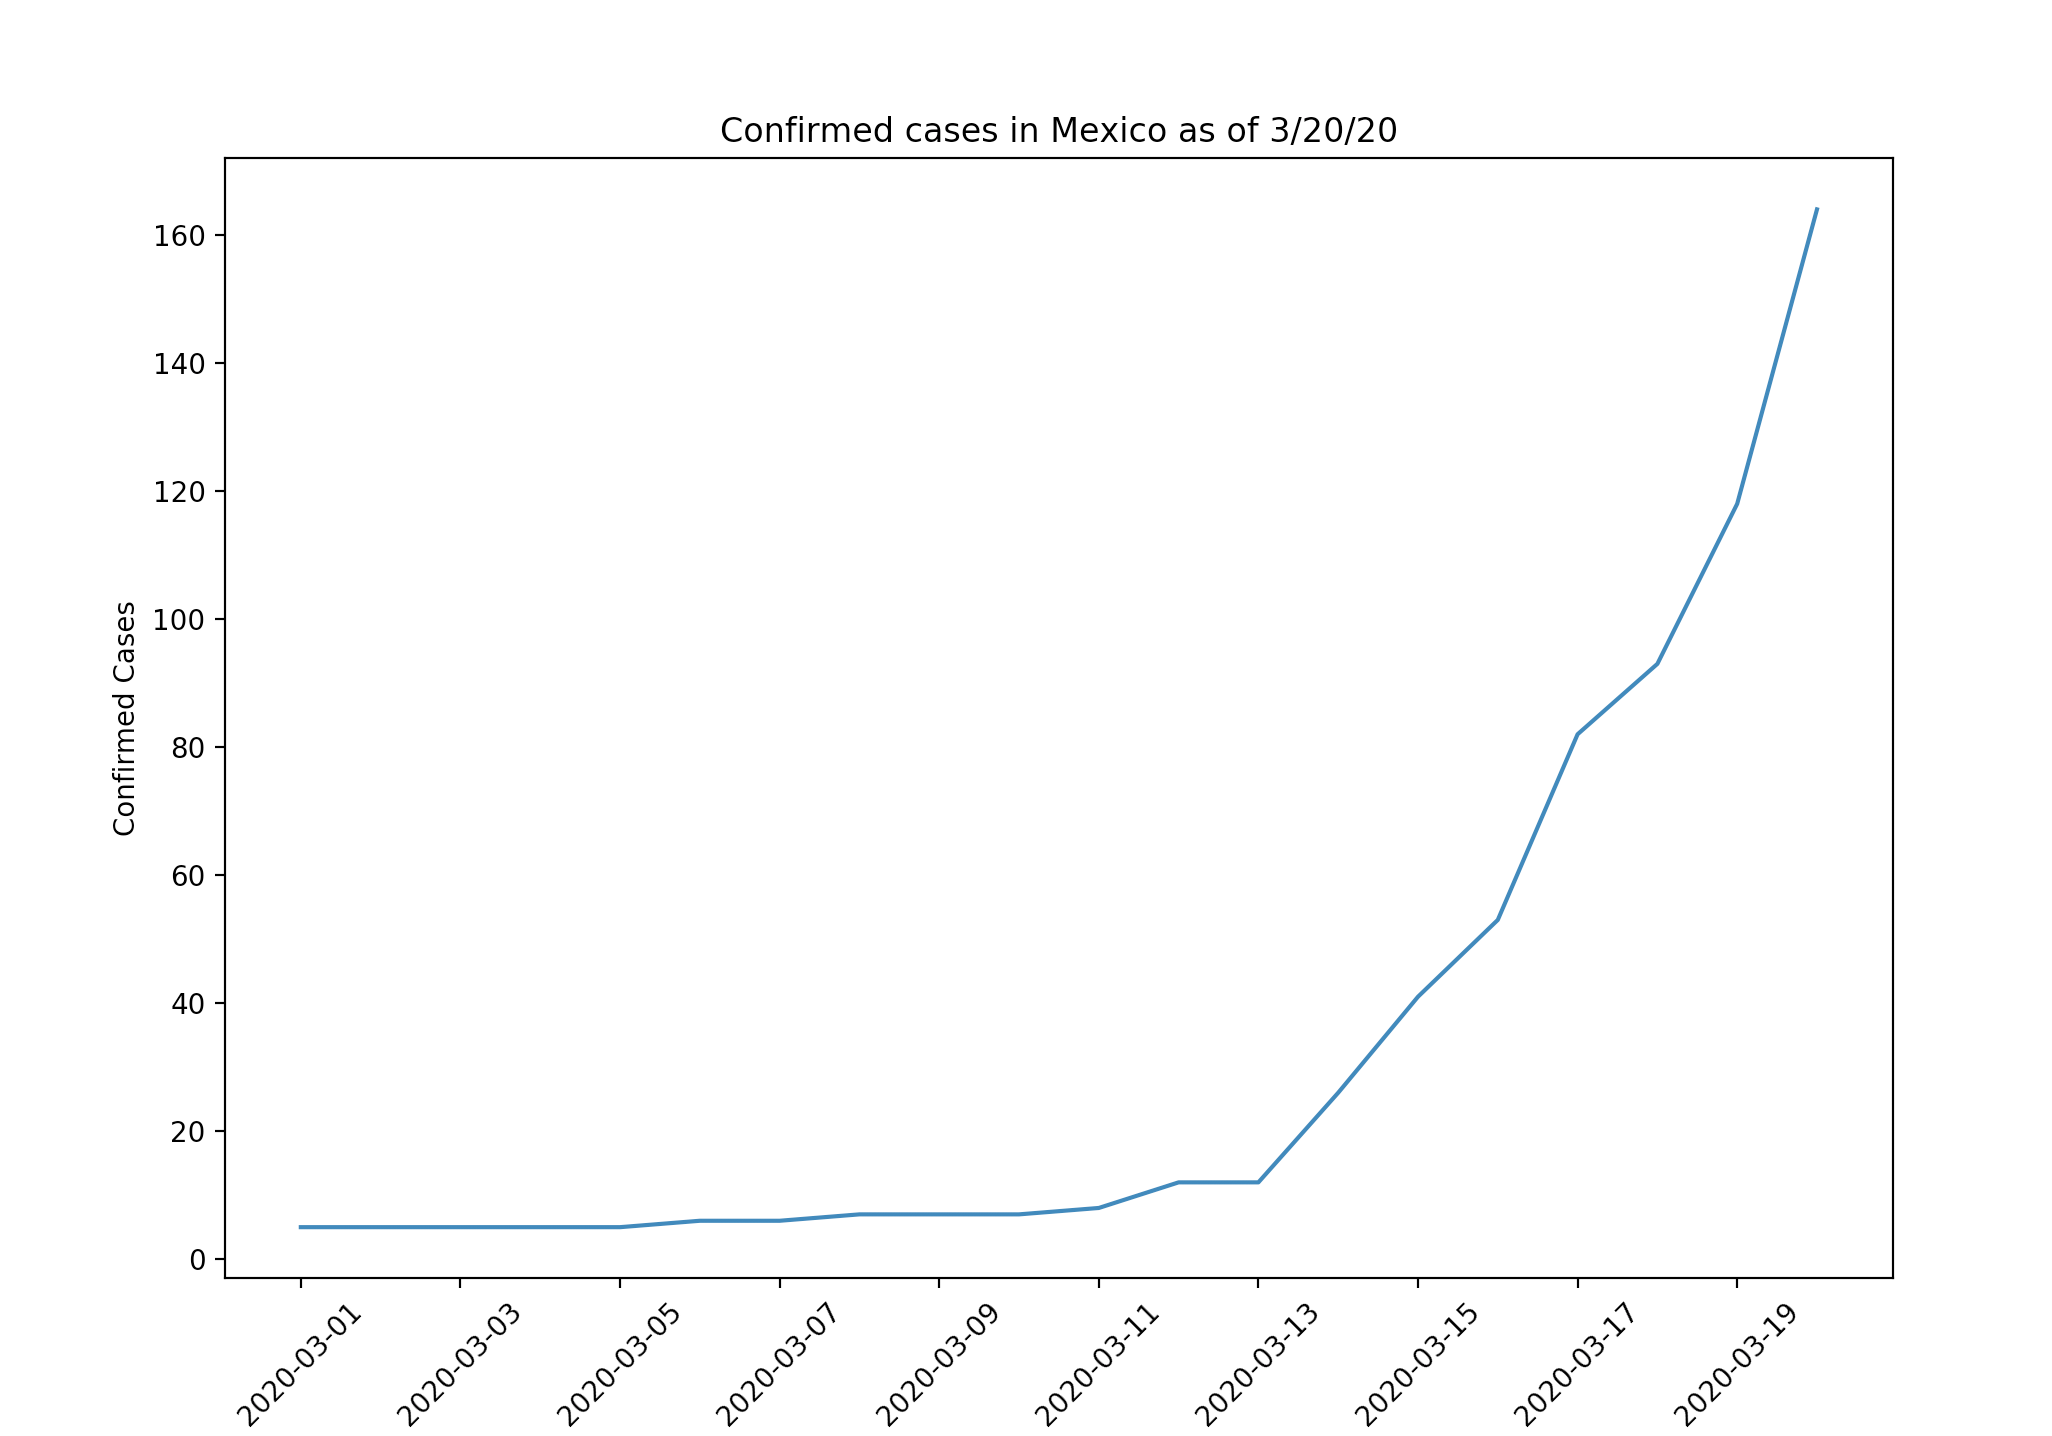
test_data.py introduces the function plot_country to visualize confirmed cases for any country up to date with pandas and matplotlib. It renders the following graph:
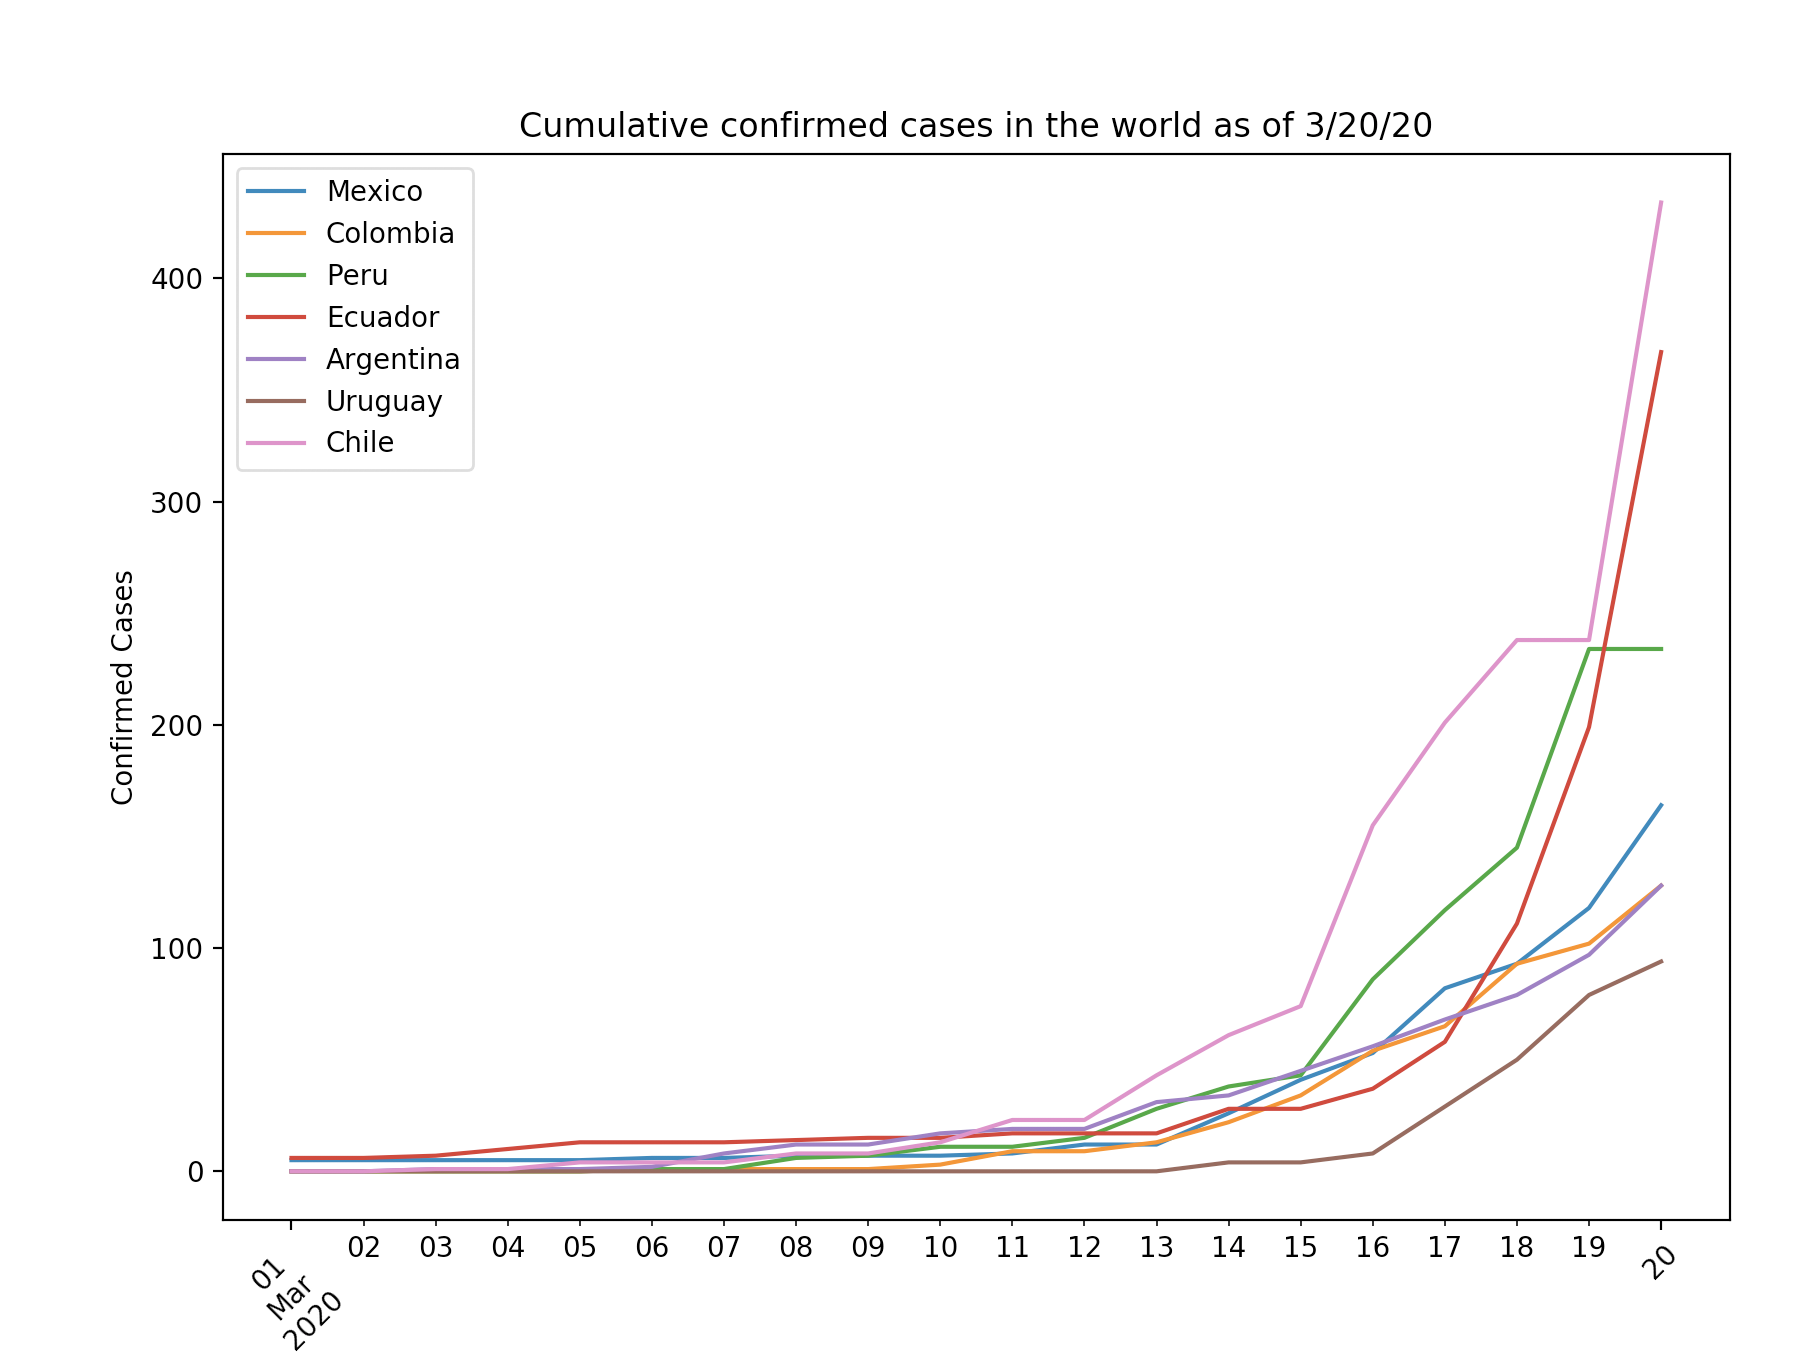
test_data.py introduces the function plot_countries to visualize confirmed cases for a group of countries up to date with pandas and matplotlib. It renders the following graph: