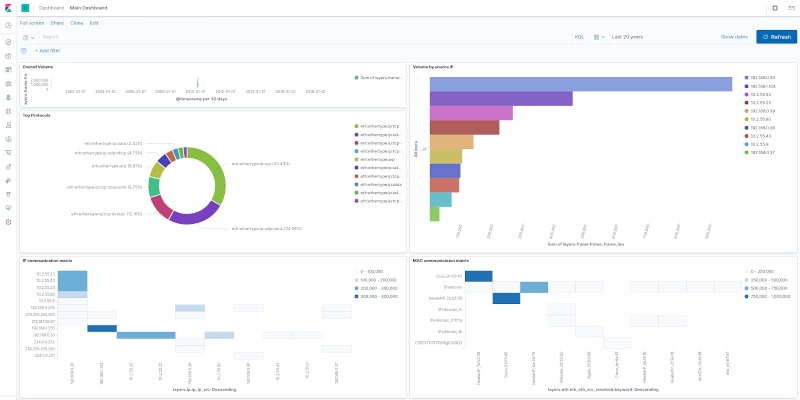
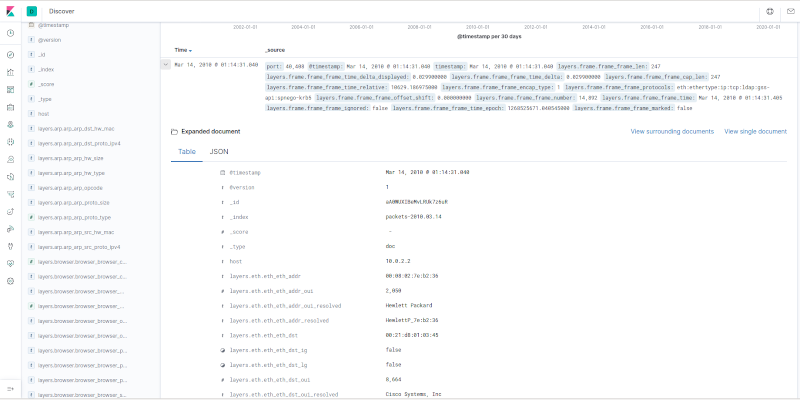
This project builds virtual machine which can be used for analytics of tshark -T ek (ndjson) output. The virtual appliance is built using vagrant, which builds Debian with pre-installed and pre-configured ELK stack.
After the VM is up, the process is simple:
- decoded pcaps (
tshark -T ek output/ ndjson) are sent overTCP/17570to the VM - ELK stack in VM will process and index the data
- Kibana is running in VM and can be accessed on
http://127.0.0.1:15601/app/kibana#/dashboards
git clone https://github.com/H21lab/tsharkVM.gitsudo apt update
sudo apt install tshark virtualbox vagrant
vagrant plugin install vagrant-disksize
vagrant plugin install vagrant-scp
bash ./build.sh# copy your pcaps into ./Trace
# upload the pcaps (with filenames)
bash upload_pcaps_with_filenames.sh
# or use vagrant scp to copy the ndjson files into /home/vagrant/input
# or upload the pcaps (without filenames)
bash upload_pcaps.sh
# or use tshark directly towards 127.0.0.1 17570/tcp
tshark -r trace.pcapng -x -T ek > /dev/tcp/localhost/17570
firefox http://127.0.0.1:15601/app/kibana#/dashboardsOpen Main Dashboard and increase time window to e.g. last 100 years to see there the sample pcaps.
cd ./VM
vagrant sshcd ./VM
vagrant destroy defaultcd ./VM
vagrant upcd ./VM
vagrant haltcd ./VM
vagrant ssh
sudo systemctl status kibana.service
sudo systemctl status elasticsearch.service
sudo systemctl status logstash.serviceIn the project is included simple Elasticseacrh mapping template generated for the frame,eth,ip,udp,tcp,dhcp protocols.
To handle additional protocols efficiently it can be required to update the mapping template in the following way:
# 1. Create custom mapping, by selecting required protocols
tshark -G elastic-mapping --elastic-mapping-filter frame,eth,ip,udp,tcp,dns > ./Kibana/custom_tshark_mapping.json

# 2. Deduplicate and post-process the mapping to fit current Elasticsearch version
ruby ./Public/process_tshark_mapping_json.rb

# 3. Upload file to vagrant VM
cd VM
vagrant upload ../Kibana/custom_tshark_mapping_deduplicated.json /home/vagrant/tsharkVM/Kibana/custom_tshark_mapping_deduplicated.json
cd ..

# 4. Connect to VM and upload template in the Elasticsearch
cd VM
vagrant ssh
cd tsharkVM/Kibana
curl -X PUT "localhost:9200/_index_template/packets_template" -H 'Content-Type: application/json' -d@custom_tshark_mapping_deduplicated.json
Alternative can be using the dynamic mapping. See template ./Kibana/template_tshark_mapping_dynamic.json. And consider setting the numeric_detection parameter true/false depending on the mapping requirements and pcaps used. Upload the template into Elasticsearch in similar way as described above.
tshark -G elastic-mapping --elastic-mapping-filter mapping could be outdated, it is not following properly the Elasticsearch changes and the output can be duplicated. The manual configuration and post-processing of the mapping template is required.
Program is distributed in the hope that it will be useful, but WITHOUT ANY WARRANTY.
The default license of source codes provided inside this project is the Apache License v2.0.
simple-NIDS is licensed under the AGPLv3 (Free Open Source GNU Affero GPL v3.0).
Additionally refer to individual licenses and terms of used of installed software (see licenses for Wireshark, Elastic and other).
Special thanks to people who helped with the Wireshark development or otherwise contributed to this work:
- Anders Broman
- Alexis La Goutte
- Christoph Wurm
- Dario Lombardo
- Vic Hargrave
Example pcap in ./Traces subfolder was downloaded from https://wiki.wireshark.org/SampleCaptures
Created by Martin Kacer
Copyright 2021 H21 lab, All right reserved, https://www.h21lab.com

