C++ Benchmarking Tutorial
This repository is a practical example of common pitfalls in benchmarking high-performance applications. It's extensively-commented source is also available in the form of an article.
If you are interested in more advanced benchmarks - check out the unum-cloud/ParallelReductions repo and the two following articles:
Run it with a single-line command:
mkdir -p release && cd release && cmake .. && make && ./main ; cd ..Dependencies will be fetched, but it's expected that you have a modern GCC compiler. Some parts of the tutorial will not work on LLVM, MSVC, ICC, NVCC and other compilers.
Lesser known GBench features
- Random Interleaving with
--benchmark_enable_random_interleaving=true. - User-Requested Performance Counters via
libpmf. - Comparing with previous results with
compare.py.
So running command changes to:
./release/main --benchmark_enable_random_interleaving=true --benchmark_format=json --benchmark_perf_counters="CYCLES,INSTRUCTIONS"Let's compare.py our results
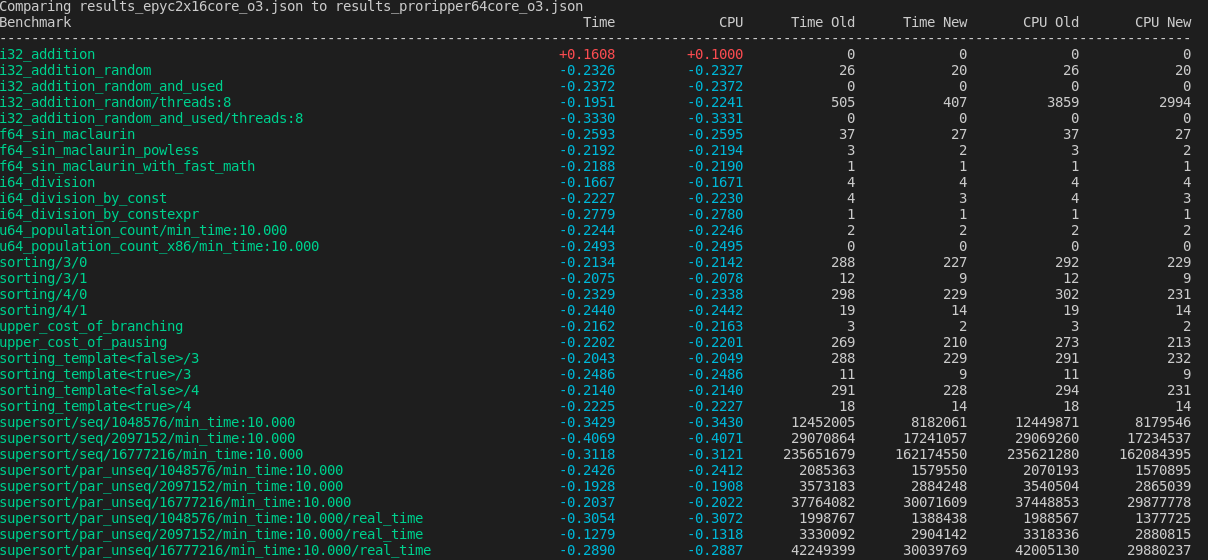
We run the same script on 2 different same-generation CPUs from AMD.
- One configuration used 2x AMD EPYC 7302 16-Core CPUs.
- Second one used AMD Threadripper PRO 3995WX
In single-threaded workloads the 64-core variant was on average ~25% faster.
Now let's isolate supersort on the Threadripper.
Let's see the effect -O3 optimizations level has over -O1.
Most notable, we have gained ~20% performance in single-threaded sorting.
Perf Results for supersort
sudo perf stat taskset 0xEFFFEFFFEFFFEFFFEFFFEFFFEFFFEFFF ./release/main --benchmark_enable_random_interleaving=true --benchmark_filter=supersortThe results on AMD Threadripper PRO 3995WX:
 Performance counter stats for 'taskset 0xEFFFEFFFEFFFEFFFEFFFEFFFEFFFEFFF ./release/main --benchmark_enable_random_interleaving=true --benchmark_filter=supersort':

       23048674.55 msec task-clock                #   35.901 CPUs utilized
           6627669      context-switches          #    0.288 K/sec
             75843      cpu-migrations            #    0.003 K/sec
         119085703      page-faults               #    0.005 M/sec
    91429892293048      cycles                    #    3.967 GHz                      (83.33%)
    13895432483288      stalled-cycles-frontend   #   15.20% frontend cycles idle     (83.33%)
     3277370121317      stalled-cycles-backend    #    3.58% backend cycles idle      (83.33%)
    16689799241313      instructions              #    0.18  insn per cycle
                                                  #    0.83  stalled cycles per insn  (83.33%)
     3413731599819      branches                  #  148.110 M/sec                    (83.33%)
       11861890556      branch-misses             #    0.35% of all branches          (83.34%)

     642.008618457 seconds time elapsed

   21779.611381000 seconds user
    1244.984080000 seconds sys
