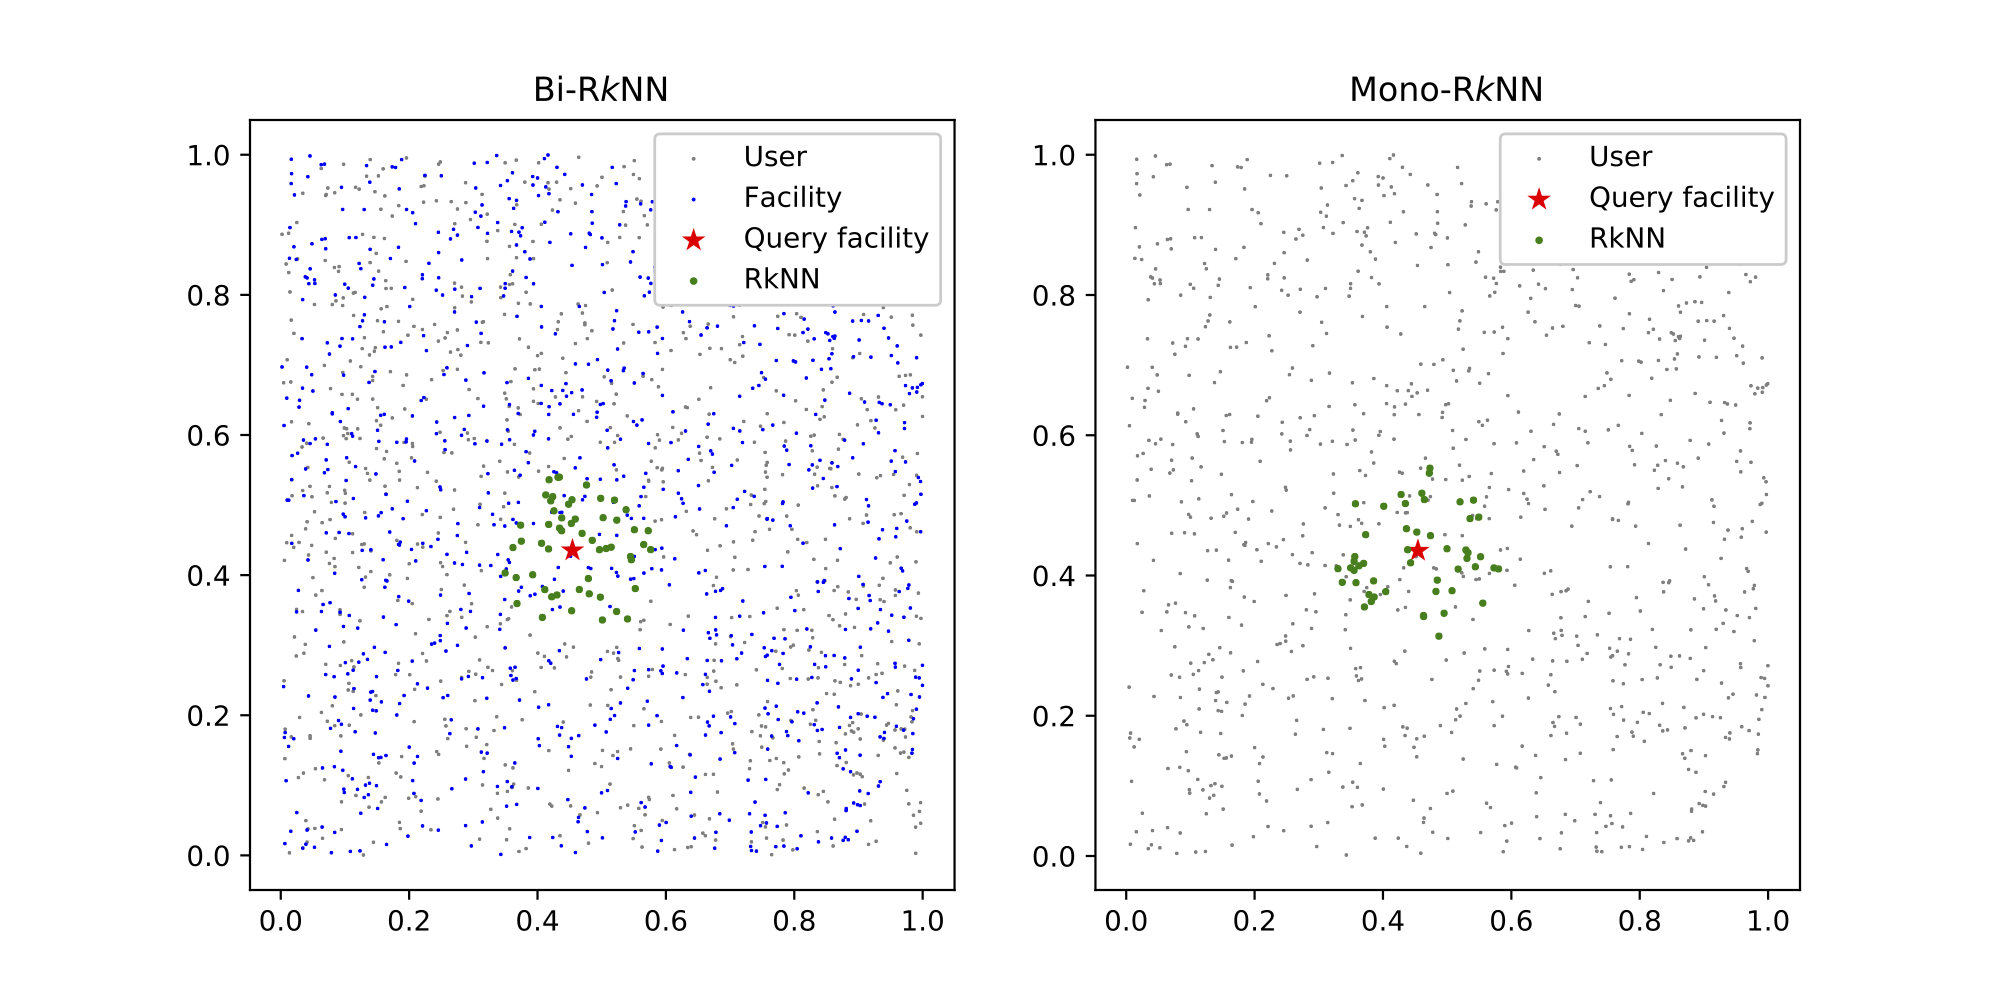
CSD-RkNN is a high-performance reverse k nearest neighbors (RkNN) query algorithm, leveraging the concept of conic section discriminance (CSD) for its efficient implementation. If you have any questions, please don't hesitate to reach out by email to the authors. Subsequent updates will be disseminated through the project's GitHub repository.
- GitHub source code: https://github.com/HPSCIL/CSD-RkNN
- Email: liyang_cs@cug.edu.cn
CSD-RkNN/:
├── data/: [data set]
│    ├── North America-1.txt
│    ├── North America-2.txt
│    ├── restaurant.csv
│    ├── mall.csv
│    ├── hospital.csv
│    ├── school.csv
│    └── residence.csv
├── common/: [common data structures, ploting functions and persistent dictionary]
│    ├── data_structure.py
│    ├── fig.py
│    └── persistence.py
├── index/: [spatial indices (including R-tree and VoR-tree)]
│    ├── rtree.py
│    └── vortree.py
├── rknn/: [RkNN algorithms (including CSD-RkNN, SLICE and VR-RkNN)]
│    ├── csd.py
│    ├── slice.py
│    └── vr.py
├── experiments.py [experiments (including benchmark experiments and case study experiments)]
└── test.py
Generate the facility set and user set:
>>> import numpy as np
>>> from shapely.geometry import Point
>>> from uuid import uuid1 as generate_uuid
>>> users = [(str(generate_uuid()), Point(np.random.uniform(0, 1), np.random.uniform(0, 1)))
             for i in range(1000)]
>>> facilities = [(str(generate_uuid()), Point(np.random.uniform(0, 1), np.random.uniform(0, 1)))
                  for i in range(1000)]
Index the facilities and users:
>>> from index.vortree import VoRtreeIndex
>>> user_index = VoRtreeIndex(data=users)
>>> facility_index = VoRtreeIndex(data=facilities)
Choose one of these facilities as the query facility:
>>> from random import choice
>>> q = facility_index.nodes[choice(facilities)[0]]
Retrieve the Bi-RkNNs of the query facility from the user set (k=50):
>>> from rknn import csd
>>> bi_rknn = [(node.uuid,node.geom) for node in csd.BiRkNN(q, 50, facility_index, user_index)]
>>> print(bi_rknn)
[('454cfe0a-527f-11ec-87c0-80e650182120', <shapely.geometry.point.Point object at 0x7ff5f106a8b0>),
 ('454cff04-527f-11ec-87c0-80e650182120', <shapely.geometry.point.Point object at 0x7ff5f361ee80>),
 ...,
 ('454d02b0-527f-11ec-87c0-80e650182120', <shapely.geometry.point.Point object at 0x7ff5f361efd0>)]
Retrieve the Mono-RkNNs of the query facility from the facility set(k=50):
>>> mono_rknn=list(csd.MonoRkNN(q,50,facility_index))
>>> print(mono_rknn)
[('454d0e40-527f-11ec-87c0-80e650182120', <shapely.geometry.point.Point object at 0x7ff5f3621460>),
 ('454d158e-527f-11ec-87c0-80e650182120', <shapely.geometry.point.Point object at 0x7ff5f36215e0>),
 ...,
 ('454d77b8-527f-11ec-87c0-80e650182120', <shapely.geometry.point.Point object at 0x7ff5f3629a60>)]
Plot the result:
>>> import matplotlib.pyplot as plt
>>> fig = plt.figure(figsize=(10, 5))bi_rknn_ax = fig.add_subplot(121)
>>> bi_rknn_ax.scatter([u[1].x for u in users], [u[1].y for u in users], marker='.', c='gray', s=8,
                       linewidths=0,label='User')
>>> bi_rknn_ax.scatter([f[1].x for f in users], [f[1].y for f in facilities], marker='.', c='blue',
                       s=8, linewidths=0, label='Facility')
>>> bi_rknn_ax.scatter(q.geom.x, q.geom.y, marker='*', c='red', s=80, linewidths=0, label='Query facility')
>>> bi_rknn_ax.scatter([b[1].x for b in bi_rknn], [b[1].y for b in bi_rknn], marker='.', c='green',
                       s=30, linewidths=0, label='RkNN')
>>> bi_rknn_ax.legend(framealpha=1,loc=1)
>>> bi_rknn_ax.set_title('Bi-R$k$NN')
>>> mono_rknn_ax = fig.add_subplot(122)
>>> mono_rknn_ax.scatter([f[1].x for f in users], [f[1].y for f in facilities], marker='.', c='gray',
                         s=8, linewidths=0,label='User')
>>> mono_rknn_ax.scatter(q.geom.x, q.geom.y, marker='*', c='red', s=80, linewidths=0, label='Query facility')
>>> mono_rknn_ax.scatter([m[1].x for m in mono_rknn], [m[1].y for m in mono_rknn], marker='.', c='green',
                         s=30, linewidths=0, label='RkNN')
>>> mono_rknn_ax.legend(framealpha=1, loc=1)
>>> mono_rknn_ax.set_title('Mono-R$k$NN')
>>> plt.show()If you want to evaluate the performance of CSD-RkNN against other algorithms (e.g., SLICE and VR-RkNN), you can run the following codes.
>>> import experiments
>>> from common.fig import plot_dual_distribution, plot_single_distribution
>>> # effect of data size on Mono-RkNN
>>> time_cost, io_cost = experiments.BenchmarkExperiments.evaluate_effect_of_data_size_on_MonoRkNN(k=10,
                                                                                                   distribution='Synthetic')
>>> plot_dual_distribution(time_cost, 'Effect-of-data-size-on-MonoRkNN-time-cost(k=10,Synthetic)')
>>> plot_dual_distribution(io_cost, 'Effect-of-data-size-on-MonoRkNN-io-cost(k=10,Synthetic)')
>>> time_cost, io_cost = experiments.BenchmarkExperiments.evaluate_effect_of_data_size_on_MonoRkNN(k=10,
                                                                                                   distribution='Real')
>>> plot_single_distribution(time_cost, 'Effect-of-data-size-on-MonoRkNN-time-cost(k=10,Real)')
>>> plot_single_distribution(io_cost, 'Effect-of-data-size-on-MonoRkNN-io-cost(k=10,Real)')
>>> time_cost, io_cost = experiments.BenchmarkExperiments.evaluate_effect_of_data_size_on_MonoRkNN(k=1000,
                                                                                                   distribution='Synthetic')
>>> plot_dual_distribution(time_cost, 'Effect-of-data-size-on-MonoRkNN-time-cost(k=1000,Synthetic)')
>>> plot_dual_distribution(io_cost, 'Effect-of-data-size-on-MonoRkNN-io-cost(k=1000,Synthetic)')
>>> time_cost, io_cost = experiments.BenchmarkExperiments.evaluate_effect_of_data_size_on_MonoRkNN(k=1000,
                                                                                                   distribution='Real')
>>> plot_single_distribution(time_cost, 'Effect-of-data-size-on-MonoRkNN-time-cost(k=1000,Real)')
>>> plot_single_distribution(io_cost, 'Effect-of-data-size-on-MonoRkNN-io-cost(k=1000,Real)').png) Time (Synthetic,k=10) |
.png) I/O (Synthetic,k=10) |
.png) Time (Synthetic,k=1000) |
.png) I/O (Synthetic,k=1000) |
.png) Time (Real,k=10) |
.png) I/O (Real,k=10) |
.png) Time (Real,k=1000) |
.png) I/O (Real,k=1000) |
>>> # effect of data size on Bi-RkNN
>>> time_cost, io_cost = experiments.BenchmarkExperiments.evaluate_effect_of_data_size_on_BiRkNN(k=10,
                                                                                                   distribution='Synthetic')
>>> plot_dual_distribution(time_cost, 'Effect-of-data-size-on-BiRkNN-time-cost(k=10,Synthetic)')
>>> plot_dual_distribution(io_cost, 'Effect-of-data-size-on-BiRkNN-io-cost(k=10,Synthetic)')
>>> time_cost, io_cost = experiments.BenchmarkExperiments.evaluate_effect_of_data_size_on_BiRkNN(k=10,
                                                                                                   distribution='Real')
>>> plot_single_distribution(time_cost, 'Effect-of-data-size-on-BiRkNN-time-cost(k=10,Real)')
>>> plot_single_distribution(io_cost, 'Effect-of-data-size-on-BiRkNN-io-cost(k=10,Real)')
>>> time_cost, io_cost = experiments.BenchmarkExperiments.evaluate_effect_of_data_size_on_BiRkNN(k=1000,
                                                                                                   distribution='Synthetic')
>>> plot_dual_distribution(time_cost, 'Effect-of-data-size-on-BiRkNN-time-cost(k=1000,Synthetic)')
>>> plot_dual_distribution(io_cost, 'Effect-of-data-size-on-BiRkNN-io-cost(k=1000,Synthetic)')
>>> time_cost, io_cost = experiments.BenchmarkExperiments.evaluate_effect_of_data_size_on_BiRkNN(k=1000,
                                                                                                   distribution='Real')
>>> plot_single_distribution(time_cost, 'Effect-of-data-size-on-BiRkNN-time-cost(k=1000,Real)')
>>> plot_single_distribution(io_cost, 'Effect-of-data-size-on-BiRkNN-io-cost(k=1000,Real)').png) Time (Synthetic,k=10) |
.png) I/O (Synthetic,k=10) |
.png) Time (Synthetic,k=1000) |
.png) I/O (Synthetic,k=1000) |
.png) Time (Real, k=10) |
.png) I/O (Real, k=10) |
.png) Time (Real, k=1000) |
.png) I/O (Real, k=1000) |
>>> # effect of k on Mono-RkNN
>>> time_cost, io_cost = experiments.BenchmarkExperiments.evaluate_effect_of_k_on_MonoRkNN('Synthetic')
>>> plot_dual_distribution(time_cost, scale='log')
>>> plot_dual_distribution(io_cost, scale='log')
>>> time_cost, io_cost = experiments.BenchmarkExperiments.evaluate_effect_of_k_on_MonoRkNN('Real')
>>> plot_single_distribution(time_cost, scale='log')
>>> plot_single_distribution(io_cost, scale='log').png) Time (Synthetic) |
.png) I/O (Synthetic) |
.png) Time (Real) |
.png) I/O (Real) |
>>> # effect of k on Bi-RkNN
>>> time_cost, io_cost = experiments.BenchmarkExperiments.evaluate_effect_of_k_on_BiRkNN('Synthetic')
>>> plot_dual_distribution(time_cost, scale='log')
>>> plot_dual_distribution(io_cost, scale='log')
>>> time_cost, io_cost = experiments.BenchmarkExperiments.evaluate_effect_of_k_on_BiRkNN('Real')
>>> plot_single_distribution(time_cost, scale='log')
>>> plot_single_distribution(io_cost, scale='log').png) Time (Synthetic) |
.png) I/O (Synthetic) |
.png) Time (Real) |
.png) I/O (Real) |
>>> # effect of number of users relative to number of facilities
>>> time_cost, io_cost = experiments.BenchmarkExperiments.evaluate_effect_of_user_num_relative_to_facility_num(10)
>>> plot_dual_distribution(time_cost)
>>> plot_dual_distribution(io_cost)
>>> time_cost, io_cost = experiments.BenchmarkExperiments.evaluate_effect_of_user_num_relative_to_facility_num(1000)
>>> plot_dual_distribution(time_cost)
>>> plot_dual_distribution(io_cost).png) Time (k=10) |
.png) I/O (k=10) |
.png) Time (k=1000) |
.png) I/O (k=1000) |
>>> # effect of data distribution
>>> time_cost, io_cost = experiments.BenchmarkExperiments.evaluate_effect_of_data_distribution(10)
>>> plot_single_distribution(time_cost)
>>> plot_single_distribution(io_cost)
>>> time_cost, io_cost = experiments.BenchmarkExperiments.evaluate_effect_of_data_distribution(1000)
>>> plot_single_distribution(time_cost)
>>> plot_single_distribution(io_cost).png) Time (k=10) |
.png) I/O (k=10) |
.png) Time (k=1000) |
.png) I/O (k=1000) |
>>> # effect RkNN queries for restaurant
>>> time_cost, io_cost = experiments.CaseStudyExperiments.evaluate_RkNN_for_restaurant()
>>> plot_single_distribution(time_cost)
>>> plot_single_distribution(io_cost)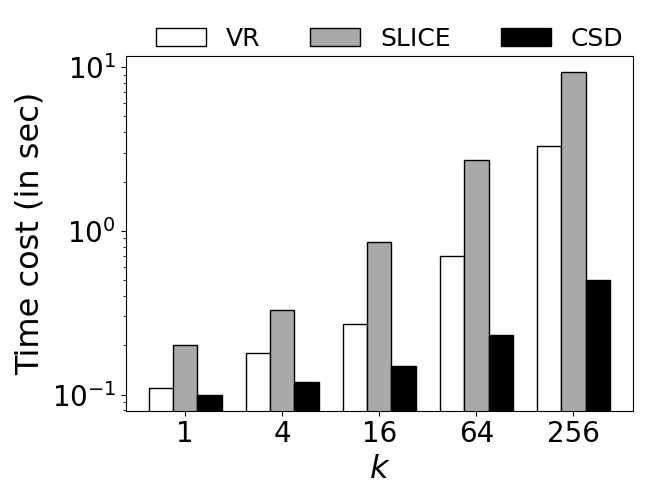 Time (Restaurant) |
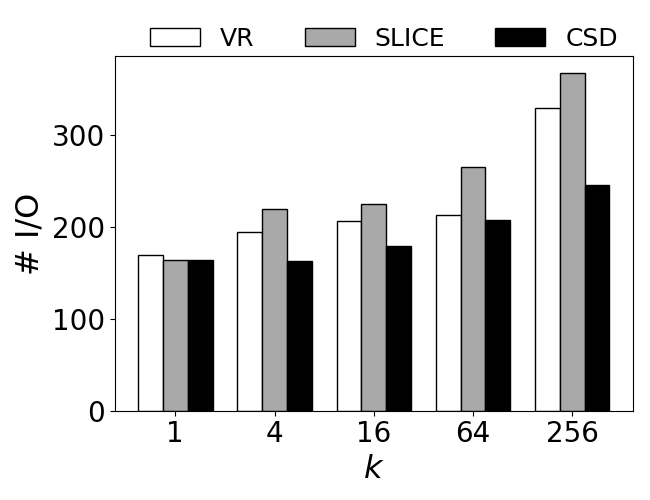 I/O (Restaurant) |
>>> # effect RkNN queries for mall
>>> time_cost, io_cost = experiments.CaseStudyExperiments.evaluate_RkNN_for_mall()
>>> plot_single_distribution(time_cost)
>>> plot_single_distribution(io_cost)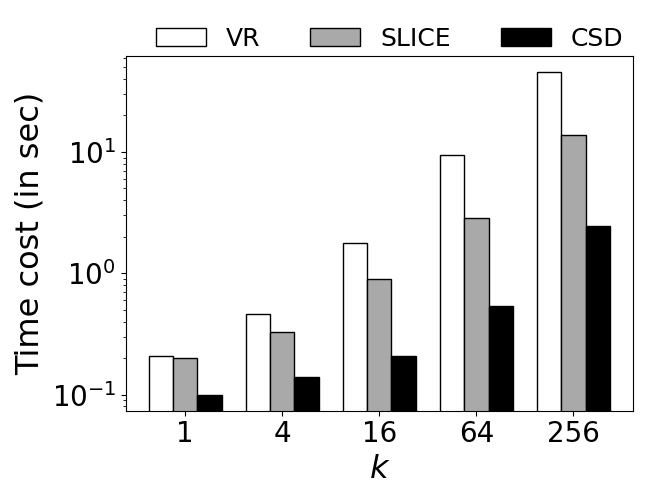 Time (Mall) |
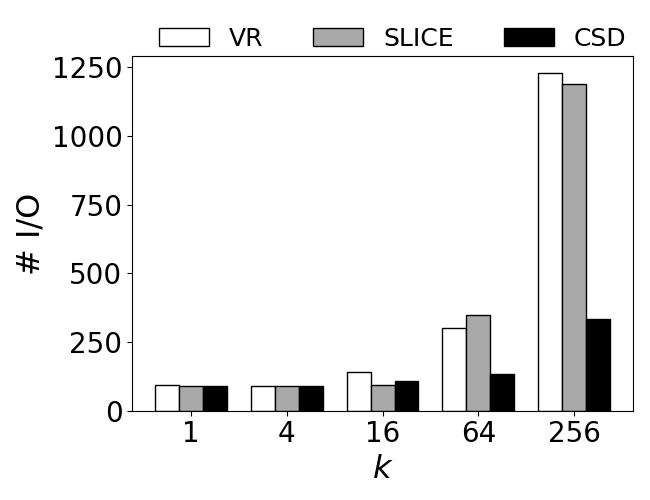 I/O (Mall) |
>>> # effect RkNN queries for hospital
>>> time_cost, io_cost = experiments.CaseStudyExperiments.evaluate_RkNN_for_hospital()
>>> plot_single_distribution(time_cost)
>>> plot_single_distribution(io_cost)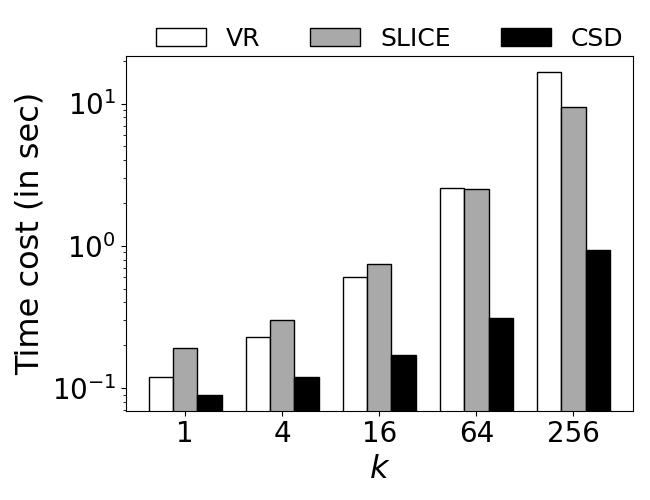 Time (Hospital) |
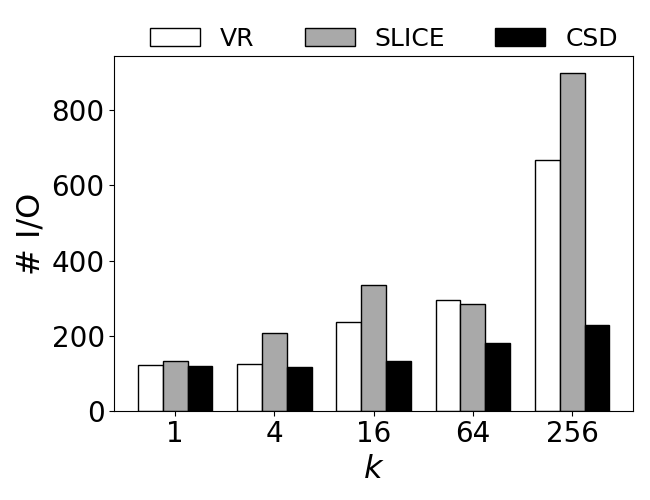 I/O (Hospital) |
>>> # effect RkNN queries for school
>>> time_cost, io_cost = experiments.CaseStudyExperiments.evaluate_RkNN_for_school()
>>> plot_single_distribution(time_cost)
>>> plot_single_distribution(io_cost)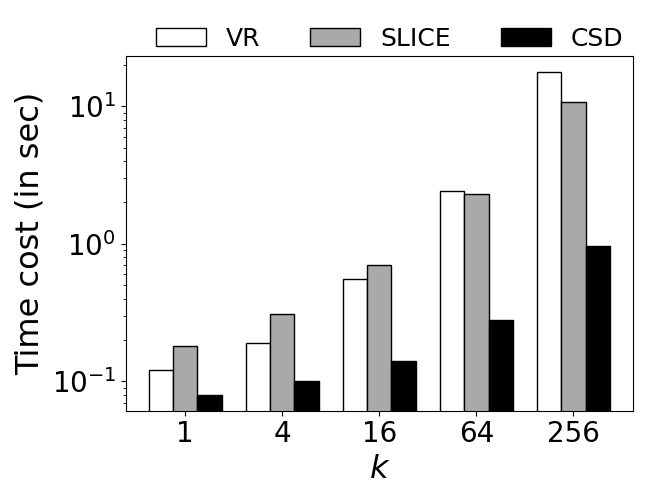 Time (School) |
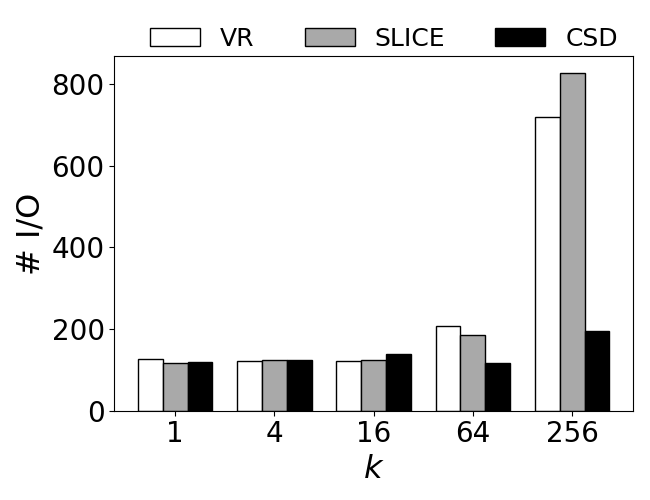 I/O (School) |
Alternatively, you can run test.py on the terminal directly:
python3 test.py
