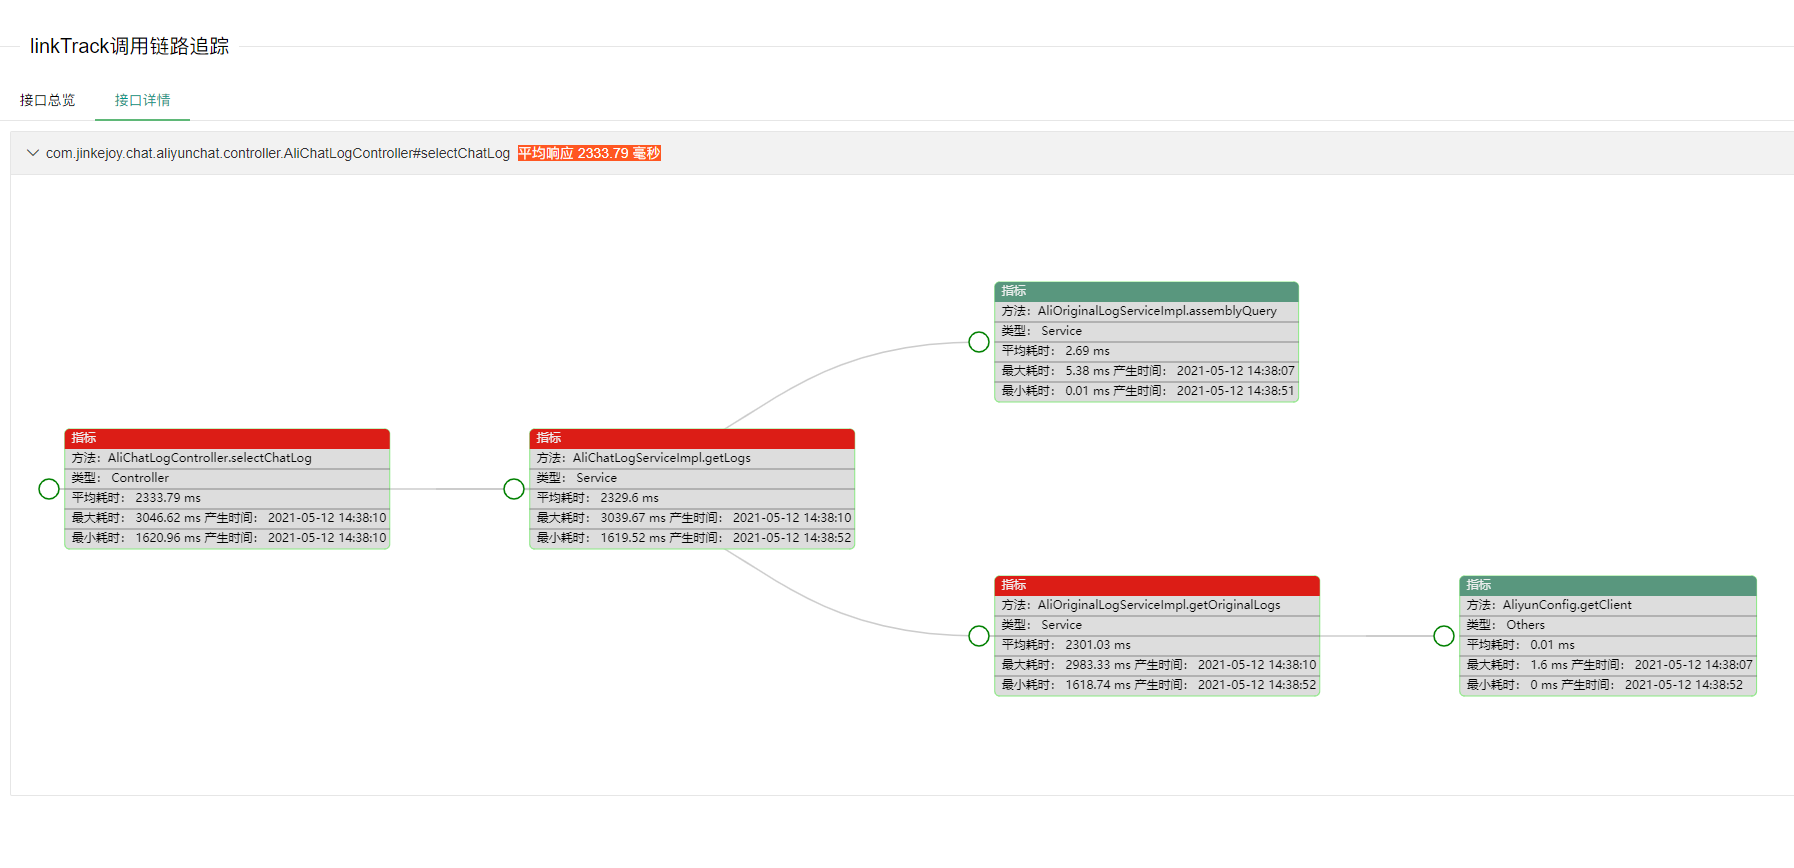
链路跟踪,最终项目每个方法的耗时,便于优化。
maven 提供了两种前端模板引擎:thymeleaf、freemarker,默认为:thymeleaf 以下使用Spring boot项目举例。
如果项目使用thymeleaf作为模板引擎,需要引入如下:
<dependency>
  <groupId>com.github.hwywl</groupId>
  <artifactId>link-track-spring-boot-starter</artifactId>
  <version>1.2.0-RELEASE</version>
</dependency>
<dependency>
    <groupId>org.springframework.boot</groupId>
    <artifactId>spring-boot-starter-thymeleaf</artifactId>
</dependency>
如果项目使用freemarker作为模板引擎,需要引入如下:
<dependency>
  <groupId>com.github.hwywl</groupId>
  <artifactId>link-track-spring-boot-starter</artifactId>
  <version>1.2.0-RELEASE</version>
</dependency>
<dependency>
    <groupId>org.springframework.boot</groupId>
    <artifactId>spring-boot-starter-freemarker</artifactId>
</dependency>
如果Spring Boot是2.4.x以下版本请使用1.1.0-RELEASE
<dependency>
  <groupId>com.github.hwywl</groupId>
  <artifactId>link-track-spring-boot-starter</artifactId>
  <version>1.1.0-RELEASE</version>
</dependency>
<dependency>
    <groupId>org.springframework.boot</groupId>
    <artifactId>spring-boot-starter-thymeleaf & freemarker</artifactId>
</dependency>
application.properties配置:
# 拦截扫描的位置,一般和项目启动类同一个包名下,这样可以扫描整个项目
link-track.log.conf.pointcut=execution(* com.jinkejoy.chat.aliyunchat..*(..))}

# 模板引擎,和引入的依赖相关,写错会404无法访问,默认为:thymeleaf
link-track.log.conf.show-template=thymeleaf

# 接口耗时的阈值,默认为500ms
link-track.log.conf.time-threshold=800
需要注意,推荐使用thymeleaf引擎,freemarker引擎的一些样式比较丑,不过功能都是一样的。
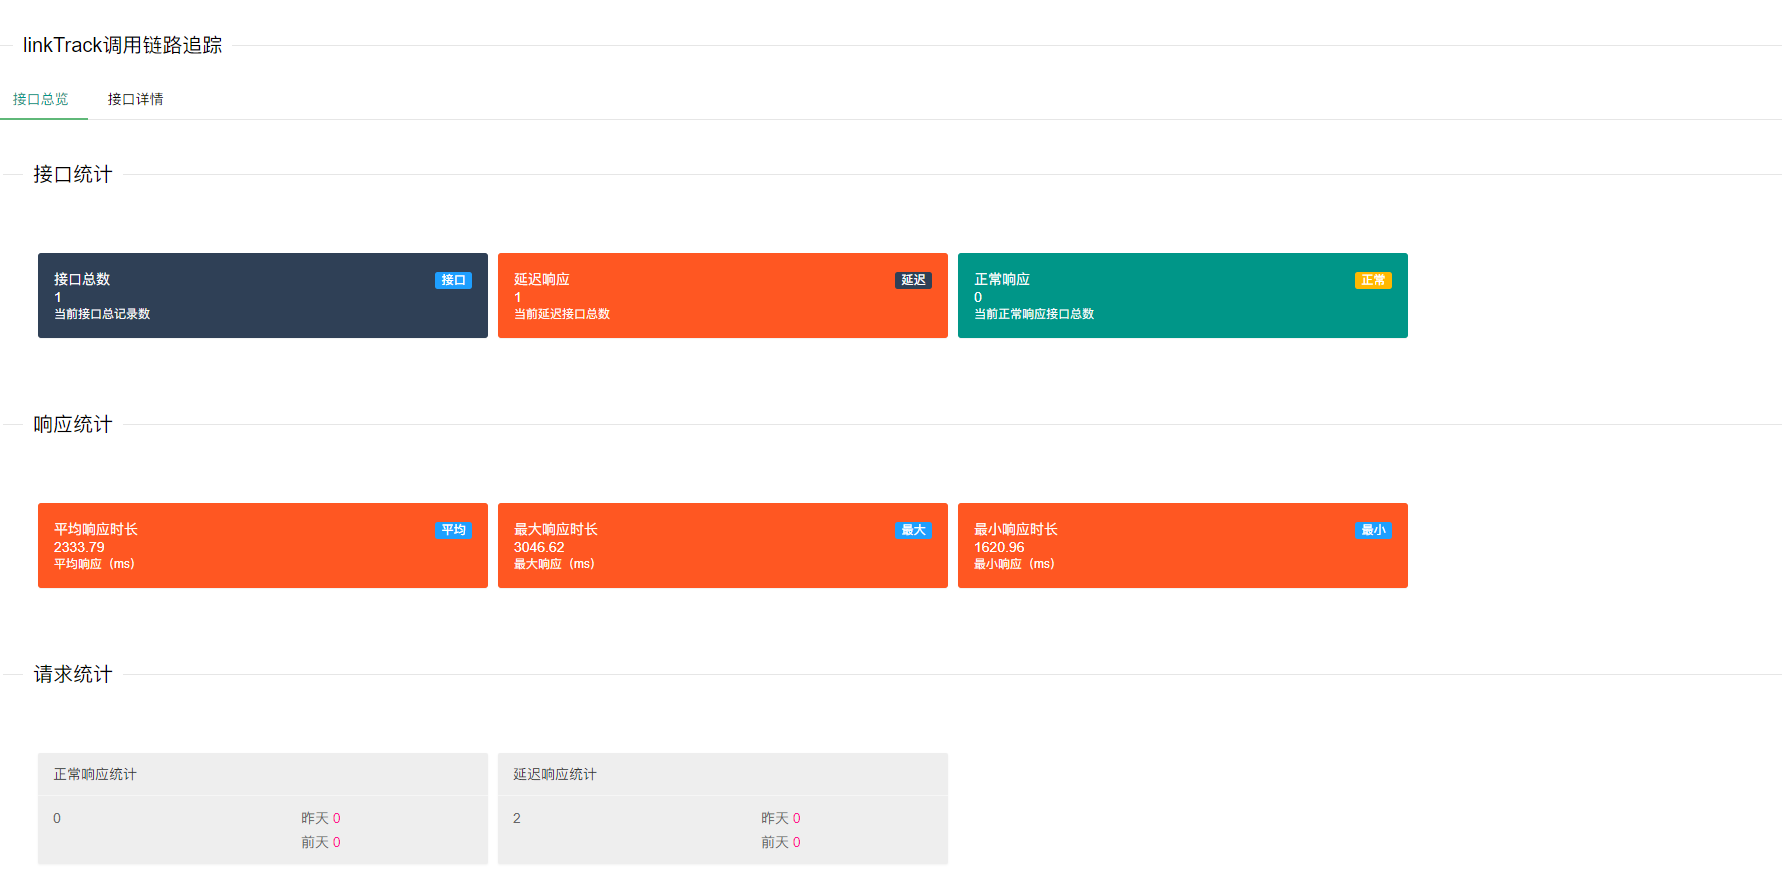
引入依赖后自带了页面,不需要单独部署,直接浏览器输入:http://ip:端口/linkTrack 即可访问。 默认打开的页面是没有任何数据了,只有项目的接口访问了才会被记录。
注解在请求接口上,即可拦截,方便调试程序

- 兼容页面支持Spring Boot 2.4.x版本
- 数据生成时间显示
- 增加每日访问总量统计
- 增加日志打印注解**@WebLog**
- 增加链路跟踪显示
- 增加接口统计
- 增加响应时间统计