This can construct the tight-binding model and calculate energies in Julia 1.0. This software is released under the MIT License, see LICENSE.
This can
- construct the Hamiltonian as a functional of a momentum k.
- plot the band structure.
- show the crystal structure.
- plot the band structure of the finite-width system with one surface or boundary.
- [09 Feb. 2019] make surface Hamiltonian from the momentum space Hamiltonian.
- [19 Nov. 2019] get DOS data and energy mesh
There is the sample jupyter notebook.
Push "]" to enter the package mode.
add TightBinding
Here is a Graphene case
using TightBinding
#Primitive vectors
a1 = [sqrt(3)/2,1/2]
a2= [0,1]
#set lattice
la = set_Lattice(2,[a1,a2])
#add atoms
add_atoms!(la,[1/3,1/3])
add_atoms!(la,[2/3,2/3])
Then we added two atoms (atom 1 and atom 2). We can see the possible hoppings.
show_neighbors(la)Output is
Possible hoppings
(1,1), x:-1//1, y:-1//1
(1,2), x:-2//3, y:-2//3
(2,2), x:-1//1, y:-1//1
(1,1), x:-1//1, y:0//1
(1,2), x:-2//3, y:1//3
(2,2), x:-1//1, y:0//1
(1,1), x:-1//1, y:1//1
(1,2), x:-2//3, y:4//3
(2,2), x:-1//1, y:1//1
(1,1), x:0//1, y:-1//1
(1,2), x:1//3, y:-2//3
(2,2), x:0//1, y:-1//1
(1,1), x:0//1, y:0//1
(1,2), x:1//3, y:1//3
(2,2), x:0//1, y:0//1
(1,1), x:0//1, y:1//1
(1,2), x:1//3, y:4//3
(2,2), x:0//1, y:1//1
(1,1), x:1//1, y:-1//1
(1,2), x:4//3, y:-2//3
(2,2), x:1//1, y:-1//1
(1,1), x:1//1, y:0//1
(1,2), x:4//3, y:1//3
(2,2), x:1//1, y:0//1
(1,1), x:1//1, y:1//1
(2,2), x:1//1, y:1//1
If you want to construct the Graphene, you choose hoppings from atom 1 to atom 2:
#construct hoppings
t = 1.0
add_hoppings!(la,-t,1,2,[1/3,1/3])
add_hoppings!(la,-t,1,2,[-2/3,1/3])
add_hoppings!(la,-t,1,2,[1/3,-2/3])
using Plots
#show the lattice structure
plot_lattice_2d(la)using Plots
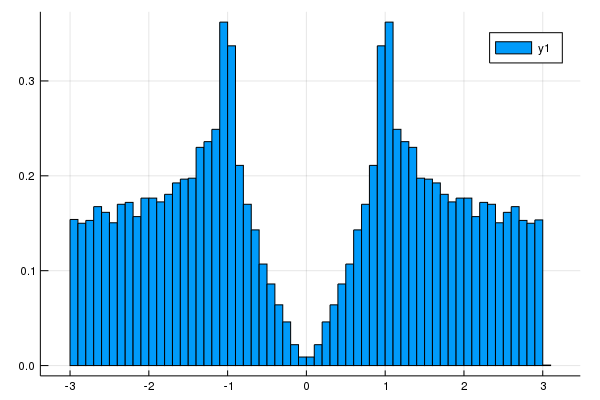
# Density of states
nk = 100 #numer ob meshes. nk^d meshes are used. d is a dimension.
plot_DOS(la, nk)[19 Nov. 2019] We can get DOS data and energy mesh.
nk = 100 #numer ob meshes. nk^d meshes are used. d is a dimension.
hist = get_DOS(la, nk)
println(hist.weights) #DOS data
println(hist.edges[1]) #energy mesh
using Plots
plot(hist.edges[1][2:end] .- hist.edges[1].step.hi/2,hist.weights)#show the band structure
klines = set_Klines()
kmin = [0,0]
kmax = [2π/sqrt(3),0]
add_Kpoints!(klines,kmin,kmax,"G","K")
kmin = [2π/sqrt(3),0]
kmax = [2π/sqrt(3),2π/3]
add_Kpoints!(klines,kmin,kmax,"K","M")
kmin = [2π/sqrt(3),2π/3]
kmax = [0,0]
add_Kpoints!(klines,kmin,kmax,"M","G")
calc_band_plot(klines,la)using Plots
#We have already constructed atoms and hoppings.
#We add the line to plot
klines = set_Klines()
kmin = [-π]
kmax = [π]
add_Kpoints!(klines,kmin,kmax,"-pi","pi")#We consider the periodic boundary condition along the primitive vector
direction = 1
#Periodic boundary condition
calc_band_plot_finite(klines,la,direction,periodic=true)#We introduce the surface perpendicular to the premitive vector
direction = 1
#Open boundary condition
calc_band_plot_finite(klines,la,direction,periodic=false)We construct two-band model for Fe-based superconductor [S. Rachu et al. Phys. Rev. B 77, 220503(R) (2008)].
la = set_Lattice(2,[[1,0],[0,1]]) #Square lattice
add_atoms!(la,[0,0]) #dxz orbital
add_atoms!(la,[0,0]) #dyz orbital
#hoppings
t1 = -1.0
t2 = 1.3
t3 = -0.85
t4 = t3
μ = 1.45

#dxz
add_hoppings!(la,-t1,1,1,[1,0])
add_hoppings!(la,-t2,1,1,[0,1])
add_hoppings!(la,-t3,1,1,[1,1])
add_hoppings!(la,-t3,1,1,[1,-1])

#dyz
add_hoppings!(la,-t2,2,2,[1,0])
add_hoppings!(la,-t1,2,2,[0,1])
add_hoppings!(la,-t3,2,2,[1,1])
add_hoppings!(la,-t3,2,2,[1,-1])

#between dxz and dyz
add_hoppings!(la,-t4,1,2,[1,1])
add_hoppings!(la,-t4,1,2,[-1,-1])
add_hoppings!(la,t4,1,2,[1,-1])
add_hoppings!(la,t4,1,2,[-1,1])

#Chemical potentials
set_μ!(la,μ) #set the chemical potential
To see the band structure, we use
klines = set_Klines()
kmin = [0,0]
kmax = [π,0]
add_Kpoints!(klines,kmin,kmax,"(0,0)","(pi,0)")

kmin = [π,0]
kmax = [π,π]
add_Kpoints!(klines,kmin,kmax,"(pi,0)","(pi,pi)")

kmin = [π,π]
kmax = [0,0]
add_Kpoints!(klines,kmin,kmax,"(pi,pi)","(0,0)")

using Plots
pls = calc_band_plot(klines,la)
Then, we have the band structure:
We can obtain the Hamiltonian:
ham = hamiltonian_k(la) #we can obtain the function "ham([kx,ky])".
kx = 0.1
ky = 0.2
hamk = ham([kx,ky]) #ham is a functional of k=[kx,ky].
println(hamk)Finally, we show the 5-orbital model proposed by K. Kuroki et al.[K. Kuroki et al., Phys. Rev. Lett. 101, 087004 (2008)]. The sample code is
la = set_Lattice(2,[[1,0],[0,1]])
add_atoms!(la,[0,0])
add_atoms!(la,[0,0])
add_atoms!(la,[0,0])
add_atoms!(la,[0,0])
add_atoms!(la,[0,0])

tmat = [
-0.7    0 -0.4  0.2 -0.1
-0.8    0    0    0    0
 0.8 -1.5    0    0 -0.3
   0  1.7    0    0 -0.1
-3.0    0    0 -0.2    0
-2.1  1.5    0    0    0
 1.3    0  0.2 -0.2    0
 1.7    0    0  0.2    0
-2.5  1.4    0    0    0
-2.1  3.3    0 -0.3  0.7
 1.7  0.2    0  0.2    0
 2.5    0    0  0.3    0
 1.6  1.2 -0.3 -0.3 -0.3
   0    0    0 -0.1    0
 3.1 -0.7 -0.2    0    0
]
tmat = 0.1.*tmat
imap = zeros(Int64,5,5)
count = 0
for μ=1:5
    for ν=μ:5
        count += 1
        imap[μ,ν] = count
    end
end
Is = [1,-1,-1,1,1,1,1,-1,-1,1,-1,-1,1,1,1]
σds = [1,-1,1,1,-1,1,-1,-1,1,1,1,-1,1,-1,1]
tmat_σy = tmat[:,:]
tmat_σy[imap[1,2],:] = -tmat[imap[1,3],:]
tmat_σy[imap[1,3],:] = -tmat[imap[1,2],:]
tmat_σy[imap[1,4],:] = -tmat[imap[1,4],:]
tmat_σy[imap[2,2],:] = tmat[imap[3,3],:]
tmat_σy[imap[2,4],:] = tmat[imap[3,4],:]
tmat_σy[imap[2,5],:] = -tmat[imap[3,5],:]
tmat_σy[imap[3,3],:] = tmat[imap[2,2],:]
tmat_σy[imap[3,4],:] = tmat[imap[2,4],:]
tmat_σy[imap[3,5],:] = -tmat[imap[2,5],:]
tmat_σy[imap[4,5],:] = -tmat[imap[4,5],:]

hoppingmatrix = zeros(Float64,5,5,5,5)
hops = [-2,-1,0,1,2]
hopelements = [[1,0],[1,1],[2,0],[2,1],[2,2]]

for μ = 1:5
    for ν=μ:5
        for ii=1:5
            ihop = hopelements[ii][1]
            jhop = hopelements[ii][2]
            #[a,b],[a,-b],[-a,-b],[-a,b],[b,a],[b,-a],[-b,a],[-b,-a]

            #[a,b]
            i = ihop +3
            j = jhop +3
            hoppingmatrix[μ,ν,i,j]=tmat[imap[μ,ν],ii]
            #[a,-b] = σy*[a,b] [1,1] -> [1,-1]
            if jhop != 0
                i = ihop +3
                j = -jhop +3
                hoppingmatrix[μ,ν,i,j]=tmat_σy[imap[μ,ν],ii]
            end

            if μ != ν
                #[-a,-b] = I*[a,b] [1,1] -> [-1,-1],[1,0]->[-1,0]
                i = -ihop +3
                j = -jhop +3
                hoppingmatrix[μ,ν,i,j]=Is[imap[μ,ν]]*tmat[imap[μ,ν],ii]
                #[-a,b] = I*[a,-b] = I*σy*[a,b]  #[2,0]->[-2,0]
                if jhop != 0
                    i = -ihop +3
                    j = jhop +3
                    hoppingmatrix[μ,ν,i,j]=Is[imap[μ,ν]]*tmat_σy[imap[μ,ν],ii]
                end
            end
            #[b,a],[b,-a],[-b,a],[-b,-a]
            if jhop != ihop
                #[b,a] = σd*[a,b]
                i = jhop +3
                j = ihop +3
                hoppingmatrix[μ,ν,i,j]=σds[imap[μ,ν]]*tmat[imap[μ,ν],ii]
                #[-b,a] = σd*σy*[a,b]
                if jhop != 0
                    i = -jhop +3
                    j = ihop +3
                    hoppingmatrix[μ,ν,i,j]=σds[imap[μ,ν]]*tmat_σy[imap[μ,ν],ii]
                end

                if μ != ν
                    #[-b,-a] = σd*[-a,-b] = σd*I*[a,b]
                    i = -jhop +3
                    j = -ihop +3
                    hoppingmatrix[μ,ν,i,j]=σds[imap[μ,ν]]*Is[imap[μ,ν]]*tmat[imap[μ,ν],ii]
                    #[b,-a] = σd*[-a,b] = σd*I*[a,-b] = σd*I*σy*[a,b]  #[2,0]->[-2,0]
                    if jhop != 0
                        i = jhop +3
                        j = -ihop +3
                        hoppingmatrix[μ,ν,i,j]=σds[imap[μ,ν]]*Is[imap[μ,ν]]*tmat_σy[imap[μ,ν],ii]
                    end
                end
            end
        end


    end
end

for μ=1:5
    for ν=μ:5
        for i = 1:5
            ih = hops[i]
            for j = 1:5
                jh = hops[j]
                if hoppingmatrix[μ,ν,i,j] != 0.0
                    add_hoppings!(la,hoppingmatrix[μ,ν,i,j],μ,ν,[ih,jh])
                end
            end
        end
    end
end

onsite = [10.75,10.96,10.96,11.12,10.62]
set_onsite!(la,onsite)

set_μ!(la,10.96) #set the chemical potential
Then, we plot the band structure
nk = 100
klines = set_Klines()
kmin = [0,0]
kmax = [π,0]
add_Kpoints!(klines,kmin,kmax,"(0,0)","(pi,0)",nk=nk)

kmin = [π,0]
kmax = [π,π]
add_Kpoints!(klines,kmin,kmax,"(pi,0)","(pi,pi)",nk=nk)

kmin = [π,π]
kmax = [0,0]
add_Kpoints!(klines,kmin,kmax,"(pi,pi)","(0,0)",nk=nk)

using Plots
pls = calc_band_plot(klines,la)
savefig("Fe5band.png")
We have the band structure:
This figure is consistent with Fig.2 in the paper where the hopping table is used [T. Nomura, J. Phys. Soc. Jpn. 78, 034716 (2009)].
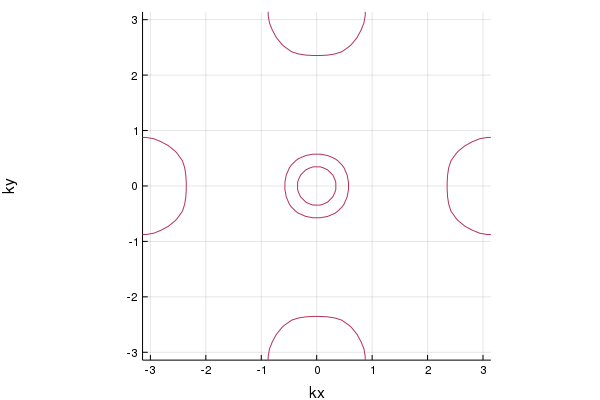
The Fermi surface is given by
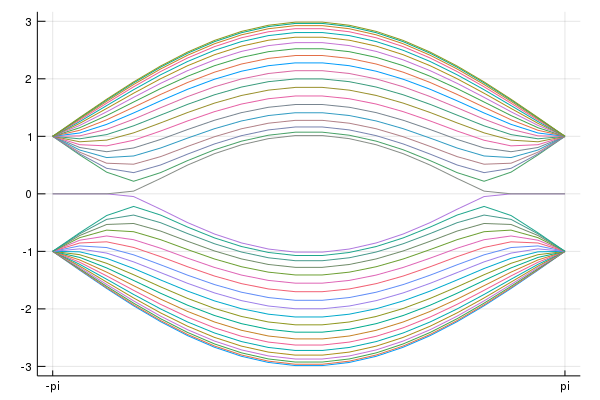
pls = plot_fermisurface_2D(la)If we have the Hamiltonian defined in momentum space, we can construct the surface Hamiltonian. For example, we consider a model of 2D topological insulator:
using TightBinding
Ax = 1
Ay = 1
m2x = 1
m2y = m2x
m0 = -2*m2x
m(k) = m0 + 2m2x*(1-cos(k[1]))+2m2y*(1-cos(k[2]))
Hk(k) = Ax*sin(k[1]).*σx +  Ay*sin(k[2]).*σy + m(k).*σz
norb = 2 #The size of the matrix
Now, when you use TightBinding.jl, the Pauli matrices σx,σy,σz,σ0 are defined. Then,
hamiltonian = surfaceHamiltonian(Hk,norb,numhop=3,L=32,kpara="kx",BC="OBC")makes the function hamiltonian(k). We can choose open boundary condition OBC or periodic boundary condition PBC. numhop determines the number of the maximum hoppings. numhop-th nearest neighbor hopping can be included. L detemines the size of the real space lattice.
using Plots
using LinearAlgebra
nkx = 100
kxs = range(-π,stop=π ,length=nkx)
mat_e = zeros(Float64,nkx,32*2)
for i=1:nkx
    kx = kxs[i]
    mat_h = hamiltonian(kx)
    #println(mat_h)

    e,v = eigen(Matrix(mat_h))
    #println(e)
    mat_e[i,:] = real.(e[:])
end
plot(kxs,mat_e,labels="")
savefig("tes1.png")
You can see the surface state.


