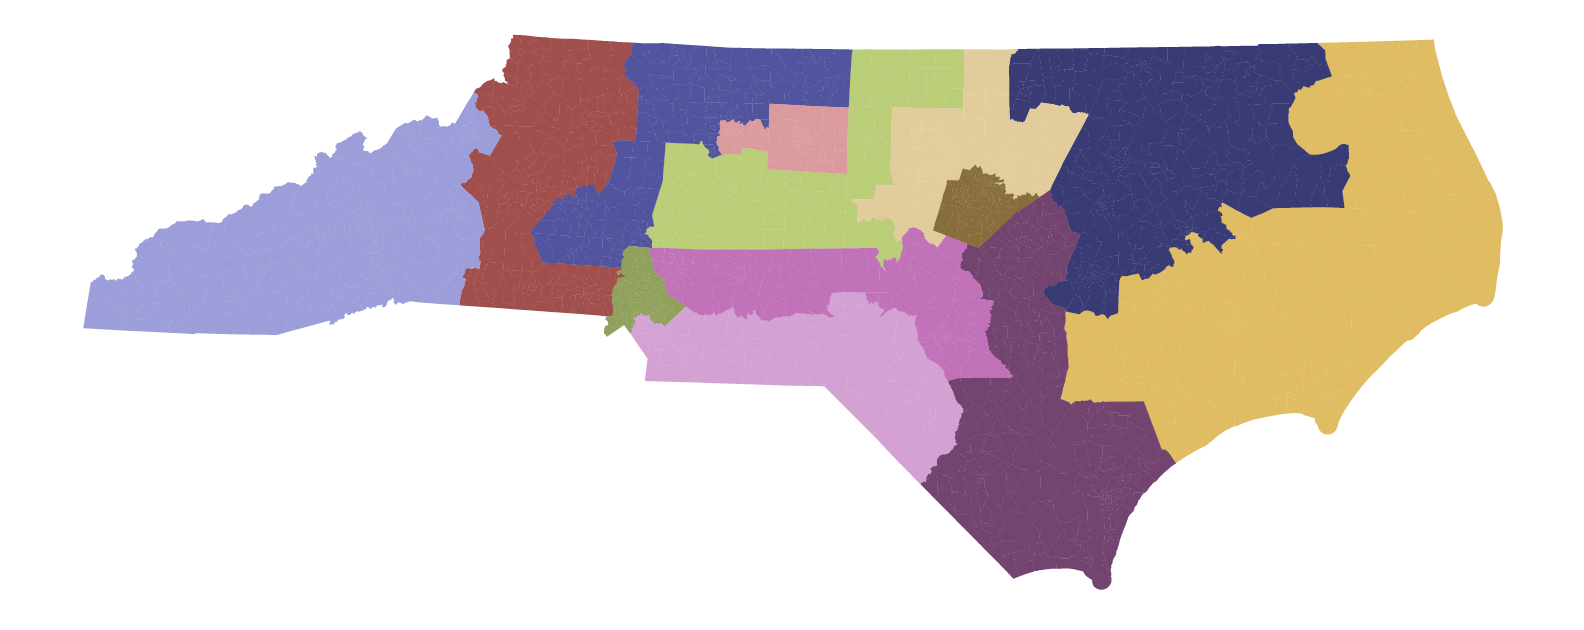
Work by Ranthony A. Clark, Susan Glenn, Harlin Lee, and Soledad Villar.
We generate biased MCMC chains using hill climbing1 and short burst2, then run an emprirical power analysis of the outlier test in Theorem 3.1 (Chikina, Frieze, Mattingly & Pegden)3.
Data is from https://github.com/mggg-states/NC-shapefiles.
The R script power_analysis.R analyzes the summary file df_power_total.csv and produces figures in plots/power_analysis.
module load python/3.11.6
python -m venv .venv
source .venv/bin/activate
pip install gerrychain
pip install shapely==2.0.1 # this line might not be necessary but untested.
pip install -r 'https://raw.githubusercontent.com/mggg/GerryChain/main/docs/requirements.txt'
pip install descartes
pip listThis code relies heavily on consistent naming of the chain files.
-
Making unbiased and biased chains
make_unbiased_chains.shrunsmake_unbiased_chain.py.- Saves
unbiased_chains/{state}/unbiased_{election}_{n}.pkl.
- Saves
make_hill_chains.shrunsmake_hill_chains.py.- Saves chain data in
biased_chains/{state}/hill_{election}_{party}_{bias}_{n}_{id}.pkl.idcomes from current time. - Saves bias metric values in
biased_chains/{state}/hill_{election}_{party}_{bias}_{n}_{id}_lines.pdf.
- Saves chain data in
make_shorburst_chains.shrunsmake_shortburst_chain.py.- Files saved are the same as hill climbing, except they start with
shortburstinstead ofhill.
- Files saved are the same as hill climbing, except they start with
-
For a given state, calcualte metrics and generate figures for all chains
calculate_metrics.shrunscalculate_metrics.pyandmake_hists.py.- Calculated metrics are saved in
biased_chains/{state}/hill_{election}_{party}_{bias}_{n}_{id}-metrics.pklorbiased_chains/{state}/hill_{election}_{party}_{bias}_{n}_{id}-{the other party}-metrics.pkl. - Plot of metrics are in
biased_chains/{state}/hill_{election}_{party}_{bias}_{n}_{id}-plot.pdf. - Histograms, correlation heatmaps and scatter plots are in
biased_chains/{state}/{folder}/{metric biased towards}/{shortburst}-{metric used to compare histograms}.pdf,biased_chains/{state}/{folder}/{party}-correlation.pdfandbiased_chains/{state}/{folder}/scatter.pdf.
-
Run multiple trajectories for hypothesis test
run_hp_from_scratch.shrunsrun_hp_from_scratch.py.- Sample 100 maps from the chain in
fn(an output of first step), then save the results inhp/{fn}_{map_idx}_{id}.pkl. Each of this file containsmtrajectories.
-
Read results from multiple trajectories and perform hypothesis test
read_hp_results.shrunsread_hp_results.py.- Read the trajectories saved from the earlier step and save results in
{fn}_{ep}_{alpha}.csv. Aggregate these csv files (code not provided) to getdf_power_total.csvin the power analysis section.
| Parameter | Explanation | Examples |
|---|---|---|
state |
State name | NC, PA, etc 4 |
election |
Election name | PRES16, PRES12, SEN10, etc 4 |
n |
Number of steps in MCMC chain | 50000, 10000 |
bias |
Bias metric | mean_median, efficiency_gap, partisan_bias, partisan_gini, safe_seats |
party |
Party to favor | Republican or Democratic |
diversity |
Collect diversity statistics 5 | 0 or 1 |
s |
Plot only 1 out of every s numbers for readability 6 |
50 |
Shows up in run_hp_from_scratch.py and read_hp_results.py.
| Parameter | Explanation | Examples |
|---|---|---|
e |
Epsilon for hypothesis test | 0.0005 |
a |
Alpha for hypothesis test | 0.05 |
m |
Number of trajectories | 32 |
k |
Number of steps in MCMC chain | 100000 |
proposal |
MCMC chain generation method | recom (reversible), random (flipnode), chunk (chunk flip) 7 |
map |
Which maps to investigate | random (randomly select from chain), max (map with max value), min |
fn |
File name | See below |
- Where do we control parameter 100, i.e. how many maps to sample from a given chain? In the header of
run_hp_from_scratch.sh, there's a slurm parameter#SBATCH --array=1-100%50. This means run 100 of the same script in parallel but no more than 50 at a time8. fnshould be the path to where the (un)biased chain is. For example,biased_chains/NC/shortburst_PRES16_Republican_partisan_gini_10000_1719440281.pklorunbiased_chains/NC/unbiased_PRES16_50000.pkl.
- Note that
eandacan take in multiple values separated by comma. For example,--e 0.015,0.01,0.005,0.003,0.001,0.0005 --a 0.05. fnshould be the filename for trajectories fromrun_hp_from_scratch.py. It can be a single pkl file, regex that matches multiple files, or a folder name. For example,*inhp/biased_chains/NC/shortburst_PRES12_Republican_mean_median*.pklis a wildcard and can take any value. This should match 100 filenames.
Footnotes
-
Duchin, M., Needham, T., Weighill, T. (2022). The (homological) persistence of gerrymandering. Foundations of Data Science, 2022, 4(4): 581-622. doi: 10.3934/fods.2021007 ↩
-
Cannon, S., Goldbloom-Helzner, A., Gupta, V. et al. (2023). Voting Rights, Markov Chains, and Optimization by Short Bursts. Methodol Comput Appl Probab 25, 36. https://doi.org/10.1007/s11009-023-09994-1 ↩
-
Chikina, M., Frieze, A., Mattingly, J. C., & Pegden, W. (2020). Separating Effect From Significance in Markov Chain Tests. Statistics and Public Policy, 7(1), 101–114. https://doi.org/10.1080/2330443X.2020.1806763 ↩
-
https://gerrychain.readthedocs.io/en/latest/api/#gerrychain.meta.diversity.collect_diversity_stats ↩
-
Only used for scatter plots. ↩
-
https://gerrychain.readthedocs.io/en/latest/api/#module-gerrychain.proposals ↩
