This repository is a part of AMURoboHack 1.0
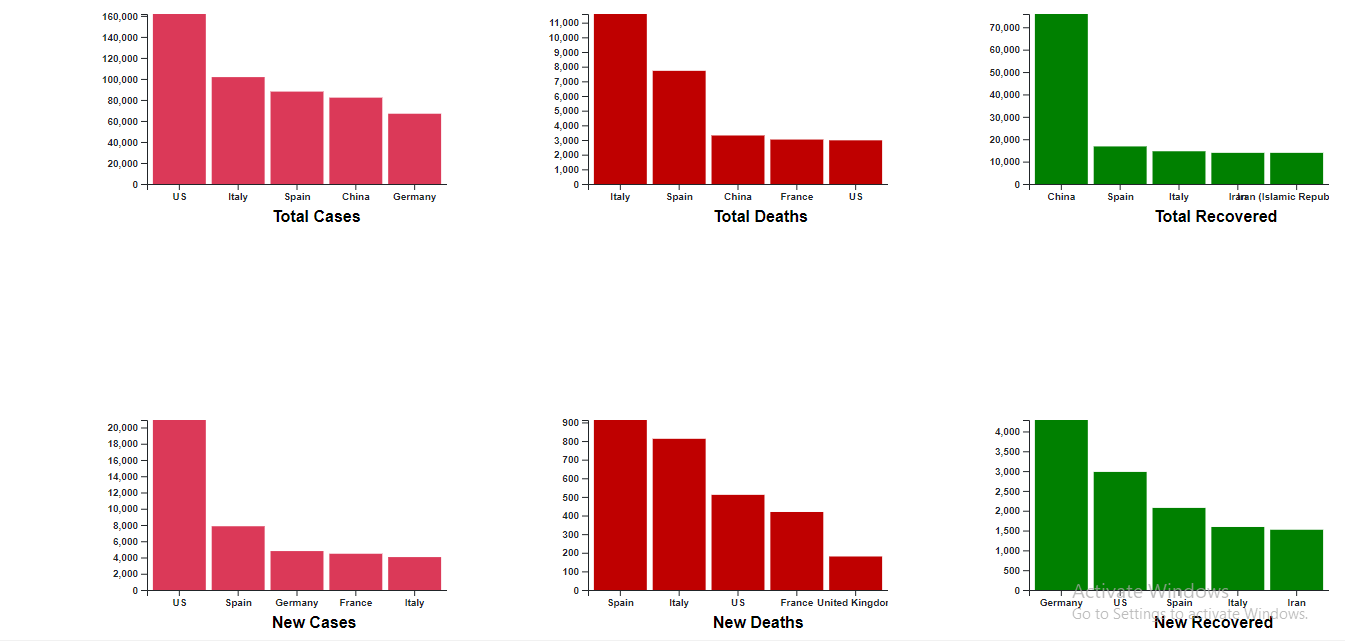
Here we tried to visulize the world data of Covid-19. Data Visulization gives an easy way to understand bunch of data. We tried plotting the data over a world map so that users can eaisly get the stats for a conuntry by just hovering the mouse pointer over the country in the world map, we also provided the zooming over the world map to bring a sense of attractiveness and user friendly interface, we have also shown the covid-19 most prone areas over bar charts which answers the most frequently asked questions such as which country has maximum number of cases so far? Maximum deaths happens in which country? Which country has recoverd most of it's people?, The Bar charts also provides stats for the current day seprately such as how many people get affected by covid-19 on this particular day? how many people get recoverd on this particular day? etc, we also provided a list of approximate 265 countries which their stats.
- Python 3.6 or above
- Python Virtual Environment
- Clone the repository to your local computer
- Activate Your Python Virtual Environment
cd Covid-19-Analysis- run
pip install -r requirements.txt - Now set the flask app using
set FLASK_APP=application.py(windows user) andexport FLASK_APP=application.py(Linux or Mac user) - Now run the app using
flask run - open your browser and go to
http://127.0.0.1:5000
- we are using Flask, Python Microframework for Web App Development
- we have used JavaScript Mainly to bring intractivity to the web page
- particularly we are using a JavaScript library D3.js (Data Driven Document) For Data Analysis
- For Plotting Maps We are using a JavaScript library topoJSON.js an extension to GeoJSON.js
- For Potting Maps and Charts we used Scalable Vector Graphics (SVG) elements to give clear pictures even on Large Zooming
- other than JavaScript we are using technologies like HTML, CSS and BootStrap to bring some more intractive and responsive nature to the webapp
- The world map provided supports zooming and on mouse hover displays the data of the corrosponding country
- we have provide a tabular format of data for all countries
- Bar Charts are shown for Areas Which are Most Infected
- SVG's are used to draw better pictorial representations
- Hashir Hameed Niazi
- Ayaan Khan
.png)
