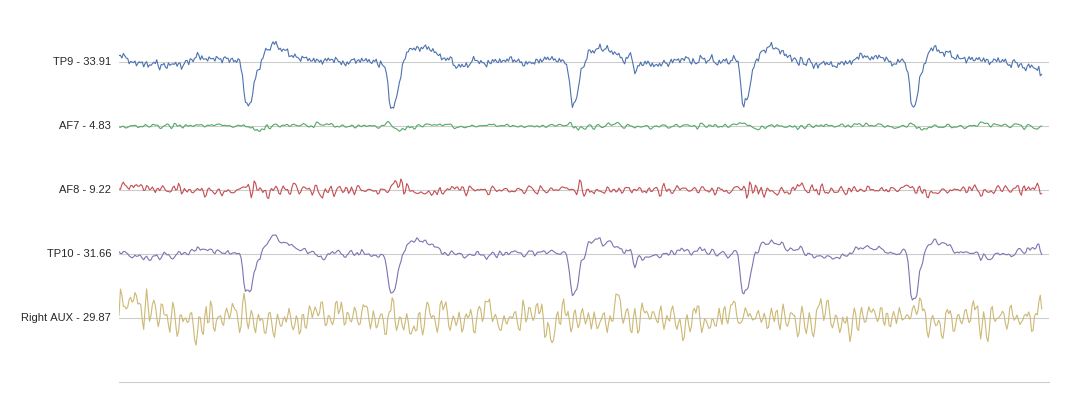
This is a collection of Python scripts to use the Muse 2016 BLE headset with LSL.
The code relies on pygatt for the BLE communication. pygatt works on Linux and should work on Windows and macOS provided that you have a BLED112 dongle. You have to use the development version of pygatt, that can be installed with pip using:
pip install git+https://github.com/peplin/pygatt
You will also need to find the MAC address of your Muse headset. This code is only compatible with the 2016 version of the Muse headset.
Finally, the code for streaming and recording data is compatible with Python 2.7 and Python 3.x. However, the code for stimulus presentation relies on psychopy and therefore only runs with Python 2.7.
To stream data with LSL:
python muse-lsl.py
The script will auto detect and connect to the first Muse device. In case you want a specific device or if the detection fails, find the name of the device and pass it to the script :
python muse-lsl.py --name YOUR_DEVICE_NAME
You can also directly pass the MAC address (this option is also faster at startup):
python muse-lsl.py --address YOUR_DEVICE_ADDRESS
Once the stream is up and running, you can visualize it with
python lsl-viewer.py
The following paradigms are available:
| Paradigm | Stimulus presentation | Data | Analysis |
|---|---|---|---|
| Visual P300 | stimulus_presentation/generate_Visual_P300.py stimulus_presentation/generate_Visual_P300_stripes.py |
data/visual/P300/ |
click here |
| Auditory P300 | stimulus_presentation/generate_Auditory_P300.py |
data/auditory/P300 |
click here |
| N170 | stimulus_presentation/generate_N170.py |
data/visual/N170 |
click here |
| SSVEP | stimulus_presentation/generate_SSVEP.py |
data/visual/SSVEP |
click here |
| SSAEP | stimulus_presentation/generate_SSAEP.py |
data/auditory/SSAEP |
click here |
| Spatial frequency | stimulus_presentation/generate_spatial_gratings.py |
data/visual/spatial_freq |
click here |
The stimulus presentation scripts can be found under stimulus_presentation/.
Some pre-recorded data is provided under data/, alongside analysis notebooks under notebooks.
The task is to count the number of cat images that you see. You can add new jpg images inside the stimulus_presentation directory: use the target- prefix for cat images, and nontarget- for dog images.
The task is to count the number of high tones that you hear.
The task is to mentally note whether a "face" or a "house" was just presented.
The task is to passively fixate the center of the screen.
The task is to passively fixate the center of the screen while listening to the sounds you hear.
The task is to passively fixate the center of the screen.
First, you have to run the muse-lsl script as described above.
In another terminal, run
python stimulus_presentation/PARADIGM.py -d 120 & python lsl-record.py -d 120
where PARADIGM.py is one of the stimulus presentation scripts described above (e.g., generate_Visual_P300.py).
This will launch the selected paradigm and record data for 2 minutes.
For data analysis, check out these notebooks.
