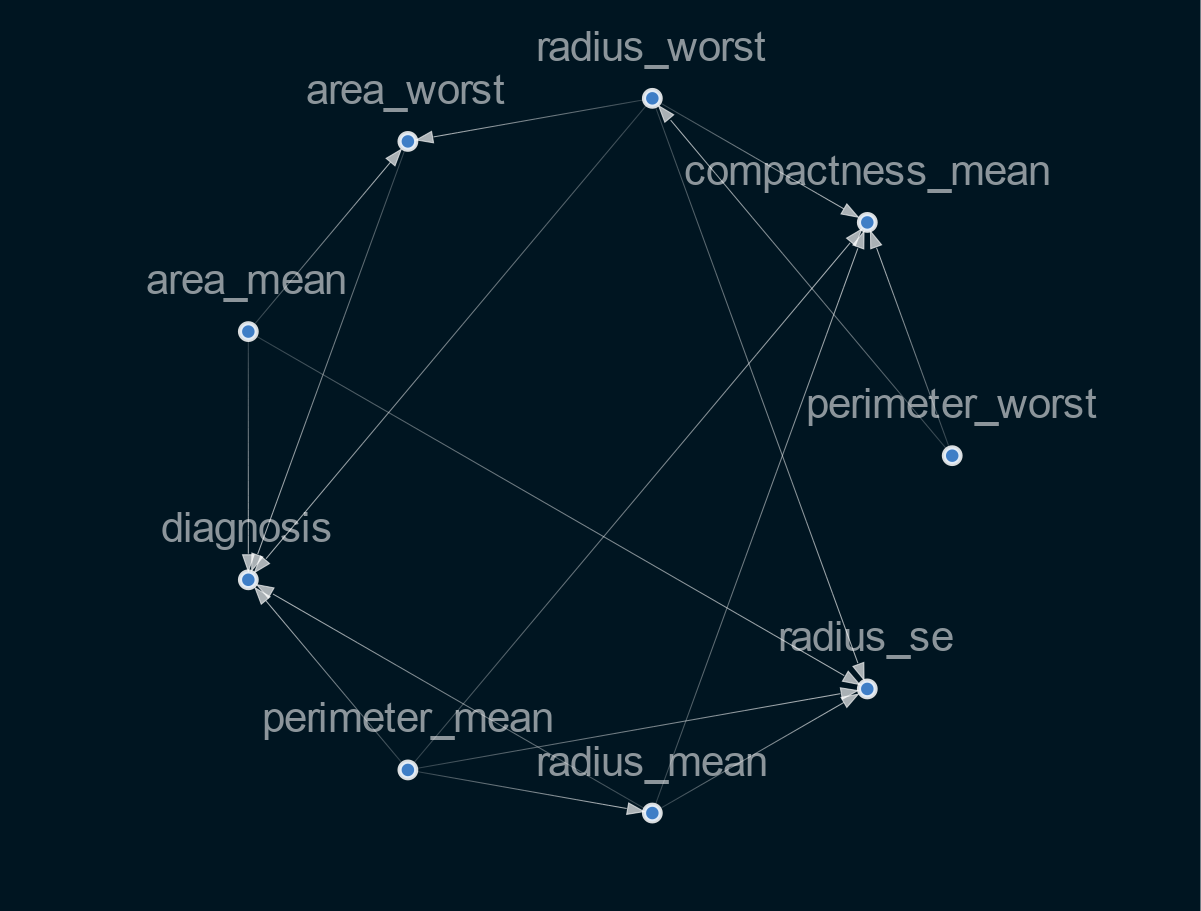
This project focusses on using causal inference to answer causal questions related to breast cancer cases. It uses a tabular data with features about cell samples of different individuals. The data used in this project is taken from kaggle. It can also be downloaded from the UCI Machine Learning Repository.
A common frustration in the industry, especially when it comes to getting business insights from tabular data, is that the most interesting questions (from their perspective) are often not answerable with observational data alone. These questions can be similar to:
“What will happen if I halve the price of my product?” “Which clients will pay their debts only if I call them?”
If done right, this method can yield a more consistent pridiction capability when compared to correlation dependent modeling.
This isn't an installable package. You can explore the notebooks I used for experimention. These include EDA, Feature Selection, Causal-Graphs, and Causal-Inference. I have also written wrappers for the libraries I used like the causalnex libarry.
- Perform EDA on the Data
- Perform Feature Selection study
- Split the data in to a training and a holdout set
- Construct a stable causal-graph from the training dataset
- Create a baseline causal-graph with all the training data
- Create a causal-graph using 40% of the training data
- Evaluate their similarity by calculating IoU with Jaccard Index
- Repeat the above with 70% of the training data
- Ones I get a stable causal-graph, I will chose only the features with a direct connection to the target column. Then do the previous step until I get a stable causal-graph with the new data.
- I train a Bayesian Network with the two versions of graph and data.
- Evaluate the trained models.
- Build an inference pipeline
- Making the CML reports more dynamic
- Adding MLFlow to the causal-graph and Bayesian Network training steps
- Adding proper doc-strings to all scripts
- Adding a feature store for the final selected best columns
- do-calculus?
Made with contrib.rocks.


