This repository contains a Python Notebook and R Shiny App created using IBM Data Science Experience. Sign up or log-in on Data Science Experience and follow along with the steps below.
- First download the repository to your local environment
- Unzip this zip file on your computer so you have a directory with all the assets in the repository. We will be using the data from the data directory.
- Log-in to Data Science Experience
- Click on the left hand side "hamburger" icon and then click on My Projects to see a list of your projects. If this is a new account, you should only see a default project.

- Click on the create project icon on the top right of the project list.

- Type a name for your project. For instance, "DSX Lab". A Spark service and an object storage will be automatically selected as well as a container with a default name. A container is a directory on the object storage. Click on Create.

- Click on the add data assets + icon

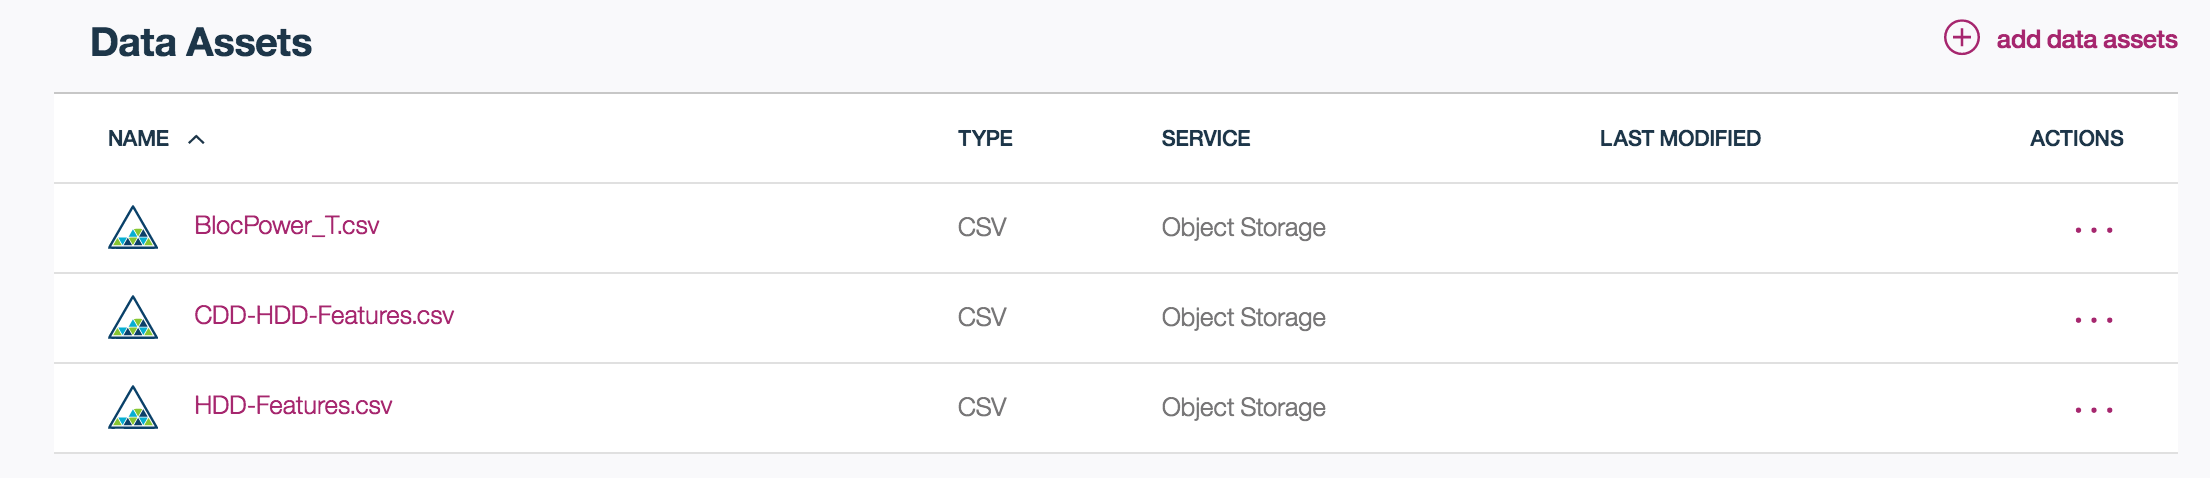
- Click on the Add file and select each of the files from the data directory of the downloaded zip: BlocPower_T, CDD-HDD_Features, and HDD_Features
- Once the file is loaded, click on Apply to add this file to your project.
- You should now see your 3 files in your project
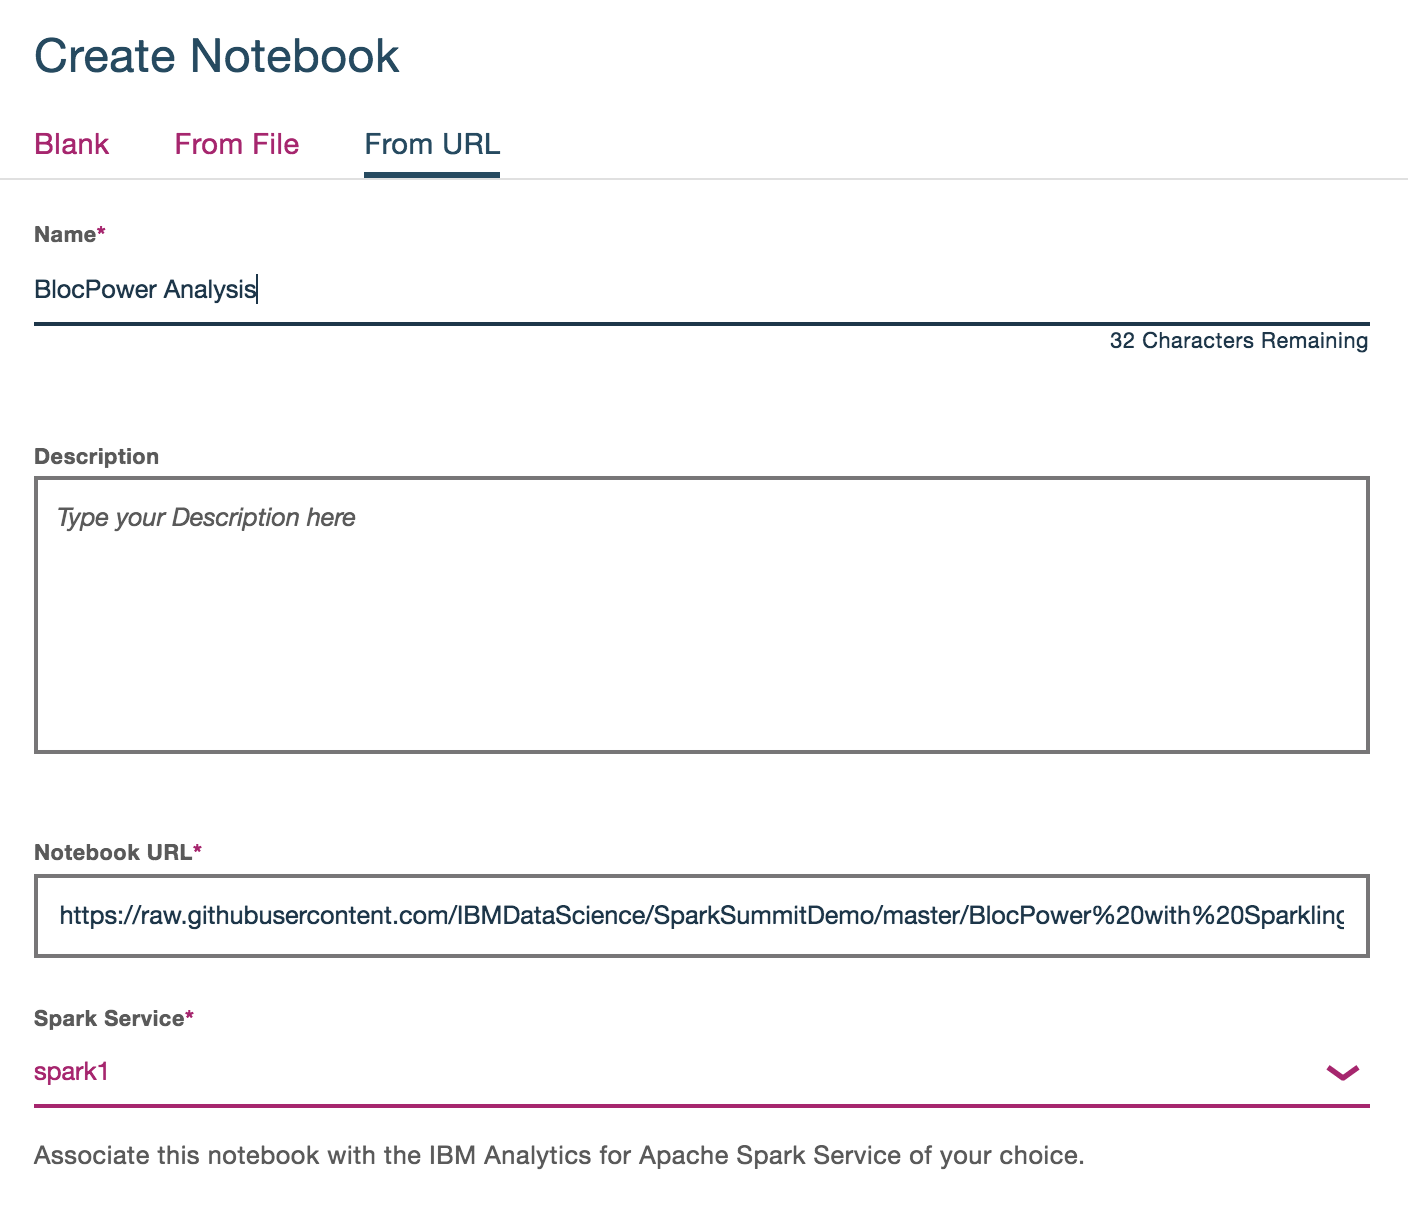
- Click on New Notebook
- Click the tab for From URL, add a Name for the notebook
- Copy the URL for the Jupyter notebook - https://raw.githubusercontent.com/IBMDataScience/SparkSummitDemo/master/BlocPower%20with%20Sparkling.ipynb
- Now you should be in the notebook you loaded from this repository
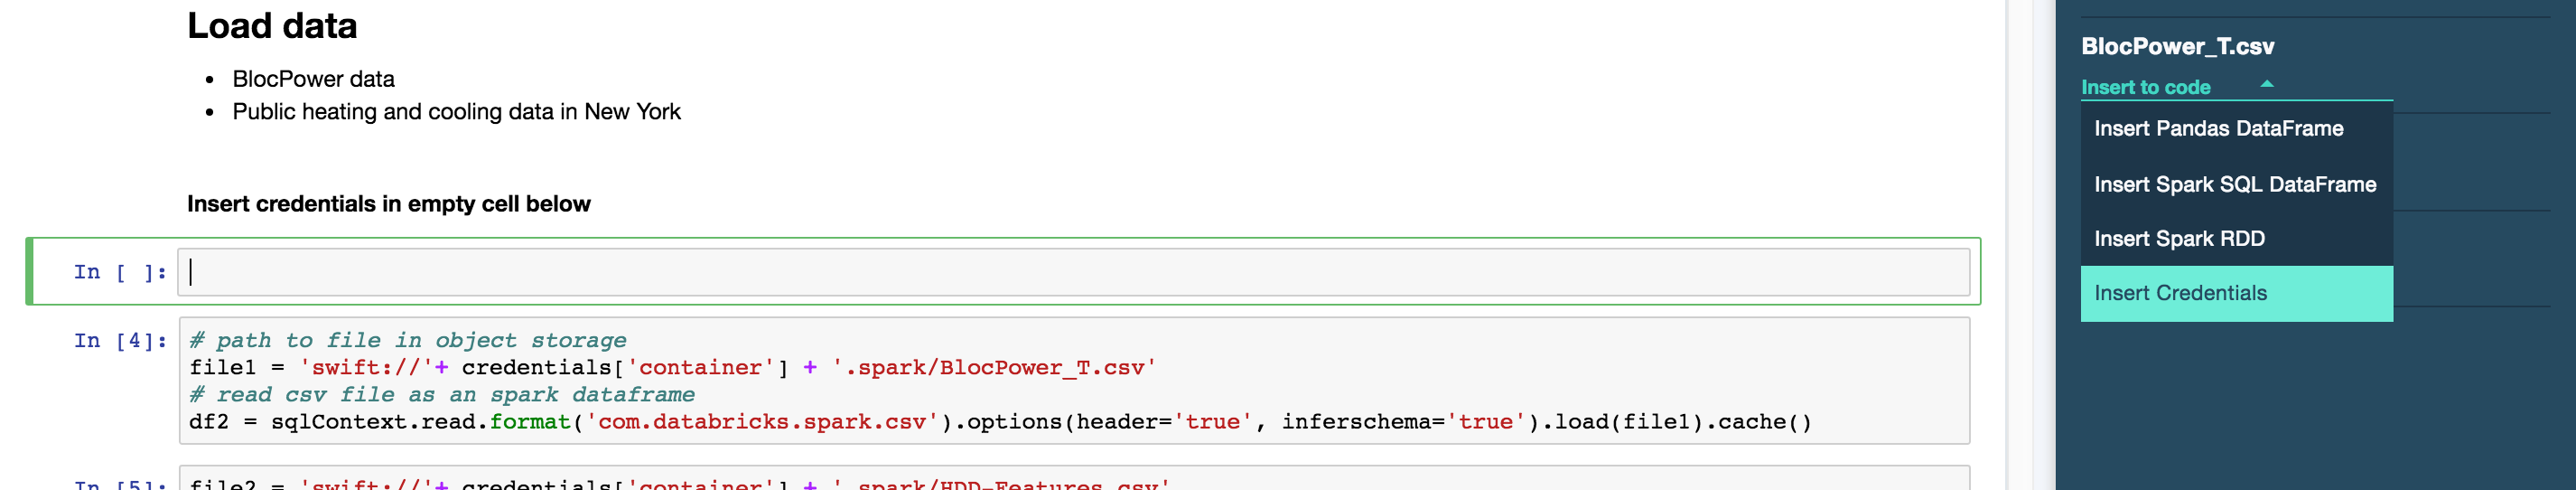
- Once you are inside the notebook, you need to insert credentials to access the data you uploaded.
- Click inside the blank cell near the top of the notebook (shown in screen shot below)
- Click on BlocPower_T.csv on the right side to Insert Credentials
** If you don't see your files click on this icon: ![]() **
**
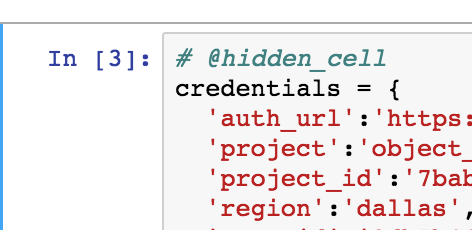
- After you add the credentials, rename the variable to be called
credentialsin code you added, shown below
- Now you can run each cell to recreate the analysis
- Follow along each of the following steps:
- Data cleaning
- Fitting a linear regression model
- Conducting k-means clustering
- Open RStudio in Data Science Experience from the left navigation bar
- Create a new R Markdown Document, select Shiny as the type R Markdown document (note you may be required to download some R packages at this time)

- Copy the raw R Markdown from here
- Replace the default content in the new R Markdown file by pasting the code in the file
- Select lines 21 - 65 and execute (This is a one time set up to install all necessary packages)
- Click the "Run Document" button to generate the dashboard from the R script
- Having popup blockers installed may interfere with launching the dashboard
- Click the button "Open in Browser" to see the app in a web browser
- Open the app in a browser to interact with it, share the link with anyone