You can read the docs from this badge
mpl_trajectory helps to plot particle trajectories as animations in matplotlib.
It can show show 3D trajectories by using the third axis as colour.
It can output a static graph or animation of the trajectories.
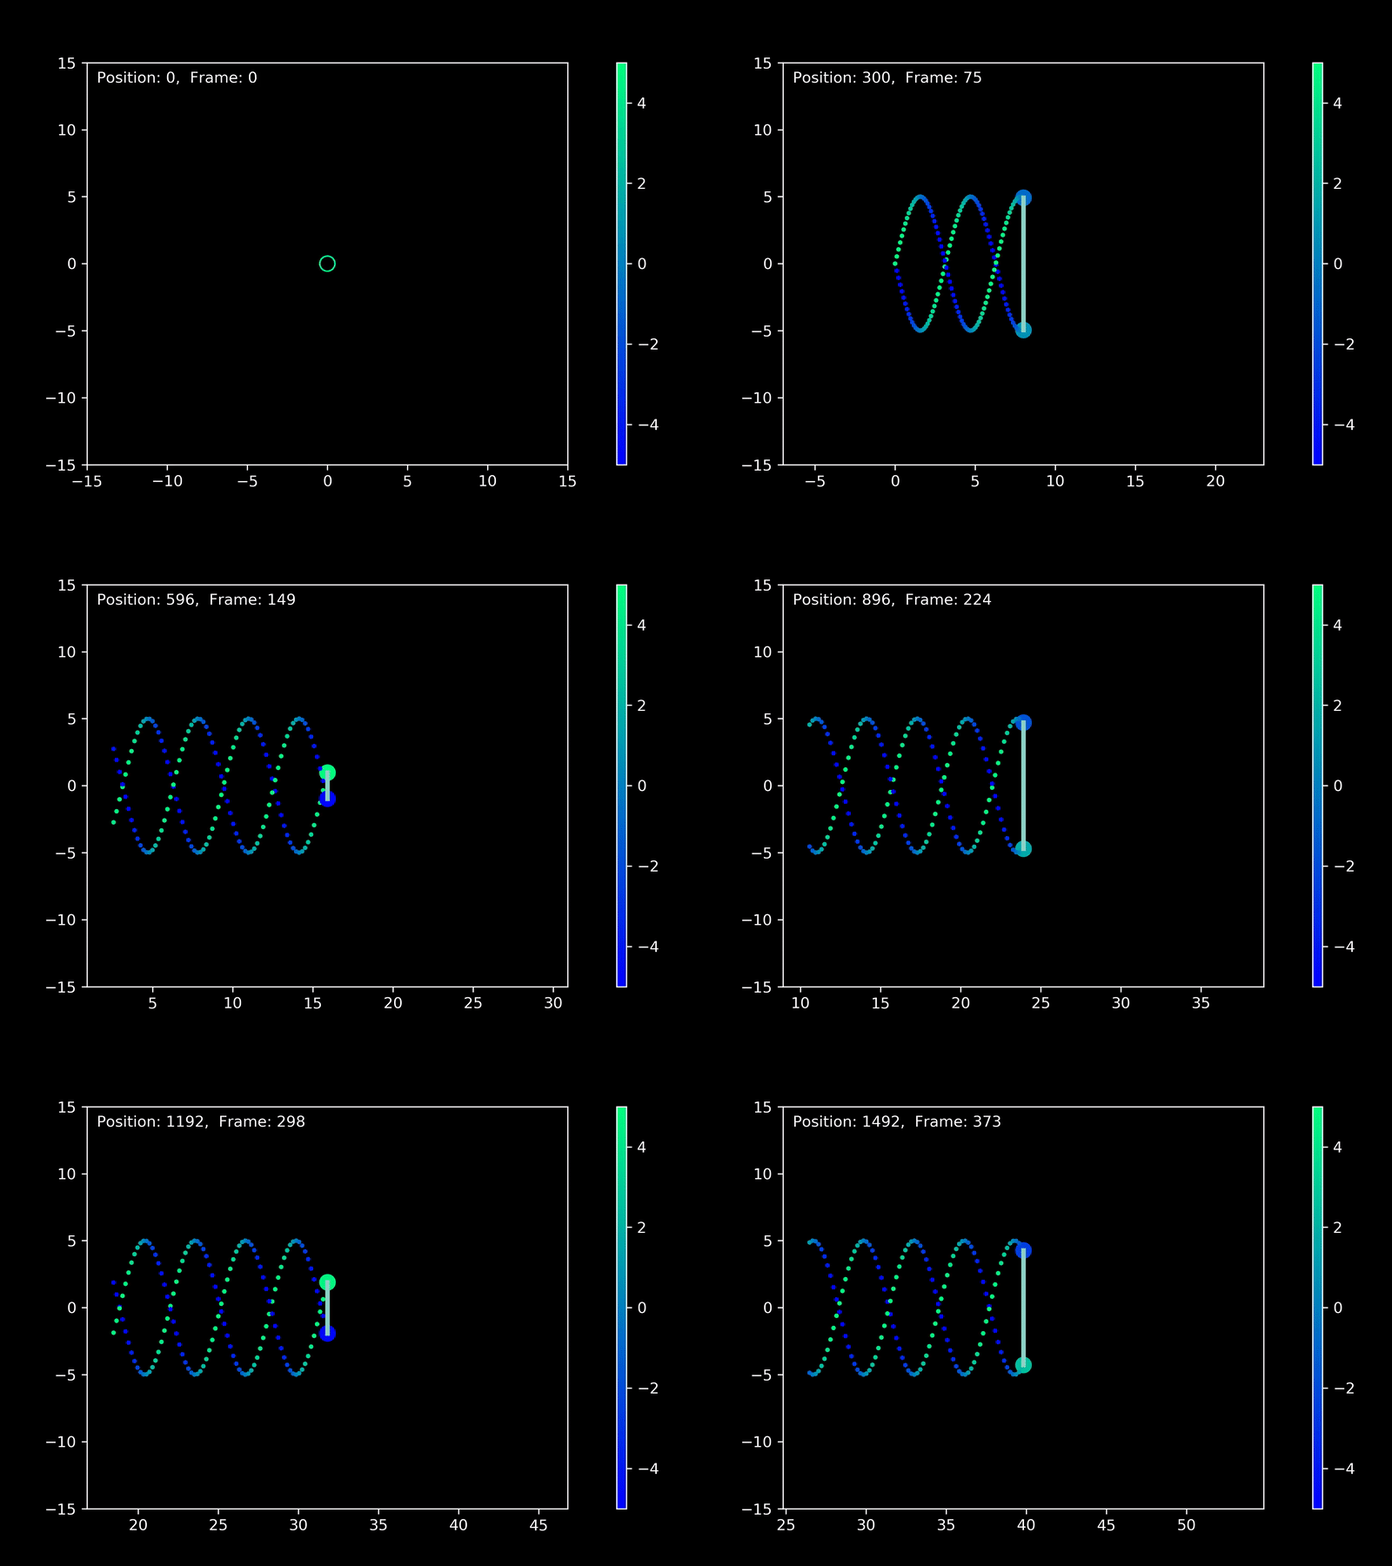
Here is an example of using the code to display two sine waves.
from mpl_trajectory import trajectory
import numpy as np
import matplotlib as mpl
import matplotlib.pyplot as plt
%matplotlib qt

plt.style.use('dark_background')

x1 = np.linspace(0,40,1500)
y1 = -5*np.sin(x1)
dydx_1 = -5*np.cos(x1)

x2 = np.linspace(0,40,1500)
y2 = 5*np.sin(x1)
dydx_2 = 5*np.cos(x1)

Traj = trajectory()
Traj.plot3D(x1,y1, dydx_1)
Traj.plot3D(x2,y2, dydx_2)
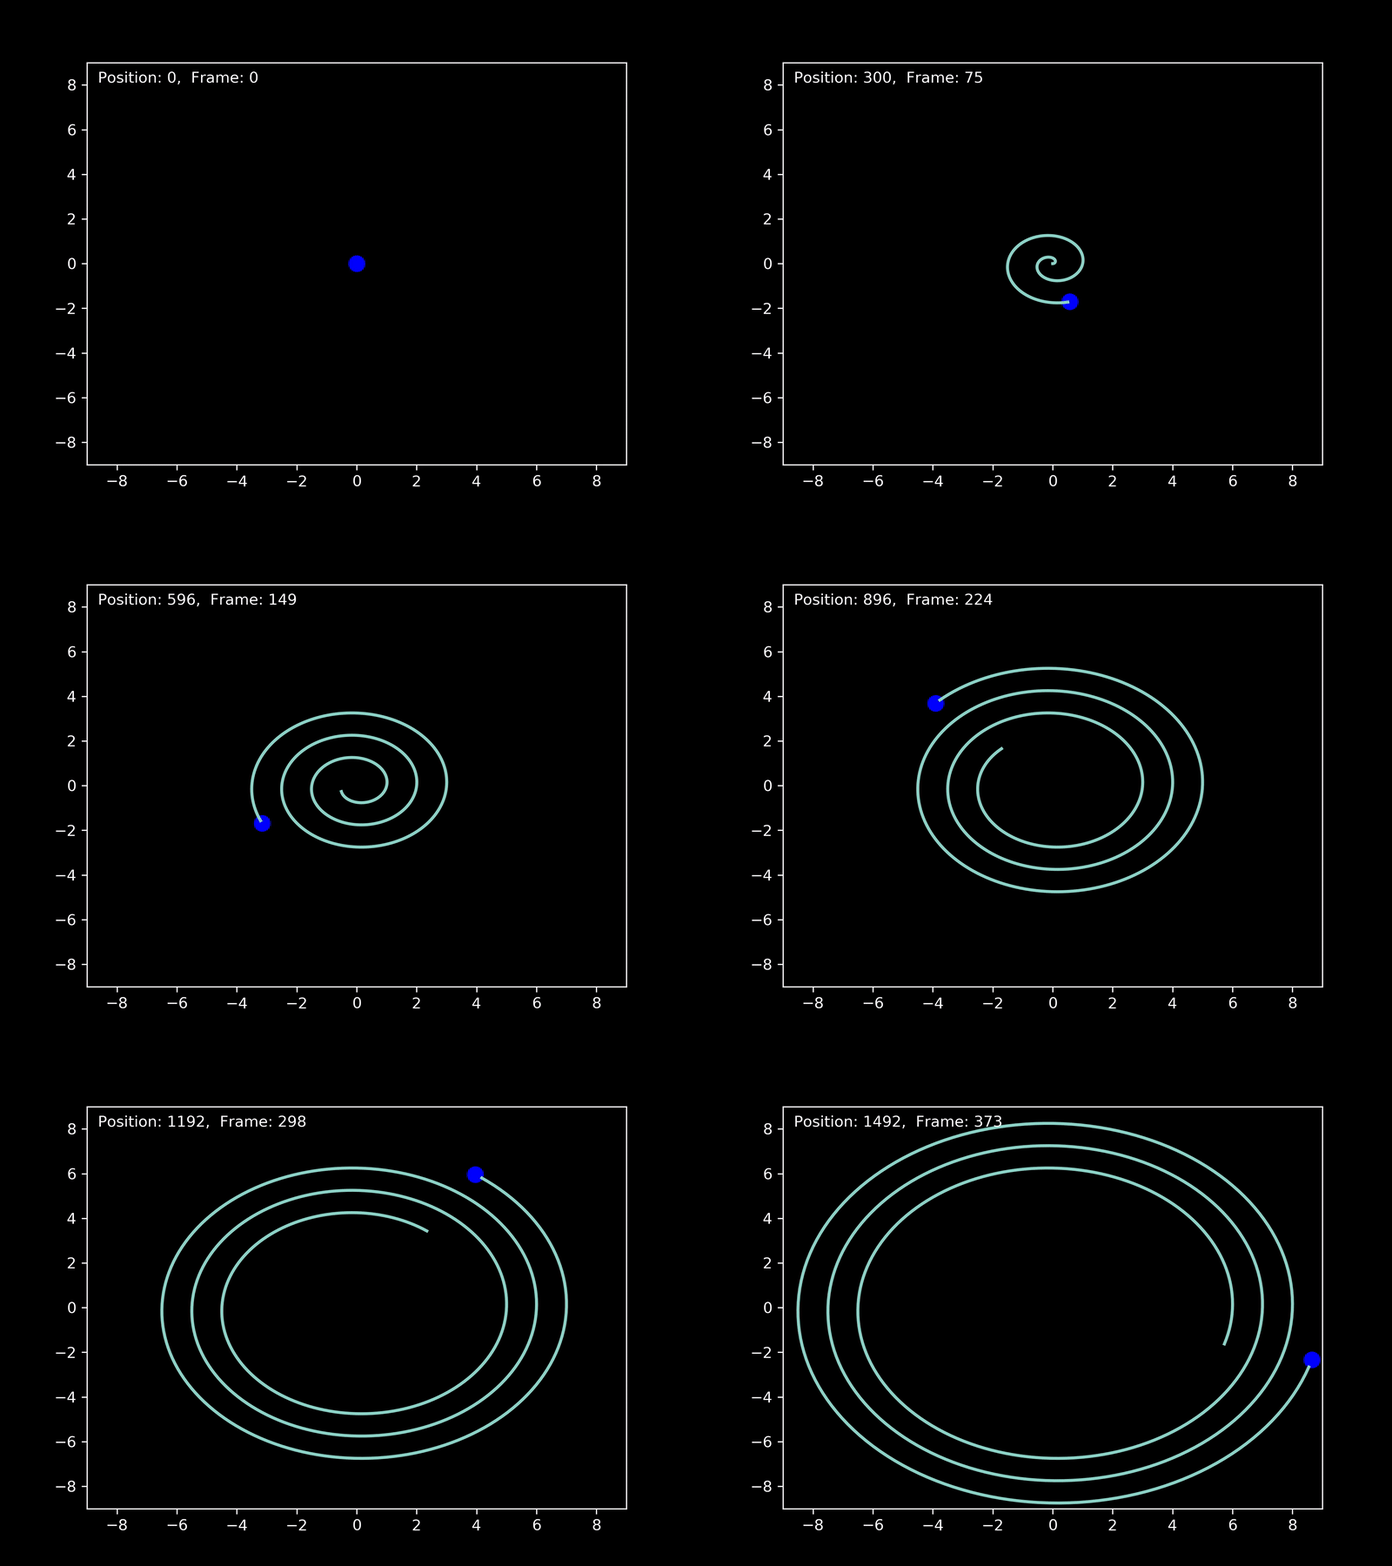
Traj.ShowAnimation(with_color = True, z_axis=[-5,5], link_data = [[1,2]])Here is an example of a spiral
from mpl_trajectory import trajectory
import numpy as np
import matplotlib as mpl
import matplotlib.pyplot as plt
%matplotlib qt

plt.style.use('dark_background')
theta = np.linspace(0,18*np.pi,1500)
r = np.linspace(0,9,1500)

x = r*np.cos(theta)
y = r*np.sin(theta)

Traj_2 = trajectory()
Traj_2.plot3D(x,y)
Traj_2.ShowAnimation(follow_mass = -3, size = 9)Traj_2.ShowStatic(with_color = True)You can use pip to install
pip install mpl-trajectoryYou must run
%matplotlib qtThe graph will pop up in a window
You can run
%matplotlib qtThe graph will pop up in a window
Or
%matplotlib notebookThis will make the animation or graph appear in the cell bellow.
If you want to save animations you must have ffmpeg for your system.


