Please contact (hyangl@umich.edu) if you have any questions or suggestions.
install.packages('ggplot2')
output
input data (3500*4; 250 length * 14 channels = 3400)
| x | variable | value | channel | |
|---|---|---|---|---|
| 1 | 0.2 | channel_01 | 0 | 1 |
| 2 | 0.4 | channel_01 | 0 | 1 |
| ... | ... | ... | ... | ... |
| 250 | 50.0 | channel_01 | 0.0000000 | 1 |
| 251 | 0.2 | channel_02 | 0.9239719 | 51 |
| 252 | 0.4 | channel_02 | 1.0000000 | 51 |
| ... | ... | ... | ... | ... |
| 3499 | 49.8 | channel_14 | 0.9167349 | 651 |
| 3500 | 50.0 | channel_14 | 1.0000000 | 651 |
code
output
input data
| x | y | name | |
|---|---|---|---|
| 1 | 0.3076133 | 0.68012495 | object 02 |
| 2 | 0.4414949 | 0.67035409 | object 02 |
| 3 | 0.5517576 | 0.64554303 | object 03 |
| .. | ... | ... | ... |
| 29 | 0.4855843 | 0.68349135 | object 12 |
| 30 | 0.2726435 | 0.34297157 | object 12 |
code
output
input data
| gene | id | value | |
|---|---|---|---|
| 1 | gene0 | id0 | 0.3663519 |
| 2 | gene0 | id1 | 0.8200528 |
| 3 | gene0 | id2 | 0.2844916 |
| ... | ... | ... | |
| 99 | gene9 | id8 | 1.0256540 |
| 100 | gene9 | id9 | 0.4010756 |
code
output
input data
| y | x | model | |
|---|---|---|---|
| 1 | 0.0046 | 0.002 | model1 |
| 2 | 0.0375 | 0.020 | model1 |
| 3 | 0.0458 | 0.030 | model1 |
| ... | ... | ... | ... |
| 99 | 0.9862 | 0.994 | model1 |
| 100 | 1.0000 | 0.999 | model1 |
| 101 | 0.0054 | 0.009 | model2 |
| 102 | 0.0064 | 0.046 | model2 |
| 103 | 0.0197 | 0.047 | model2 |
| ... | ... | ... | ... |
code
prototype python code to calculate curves
output
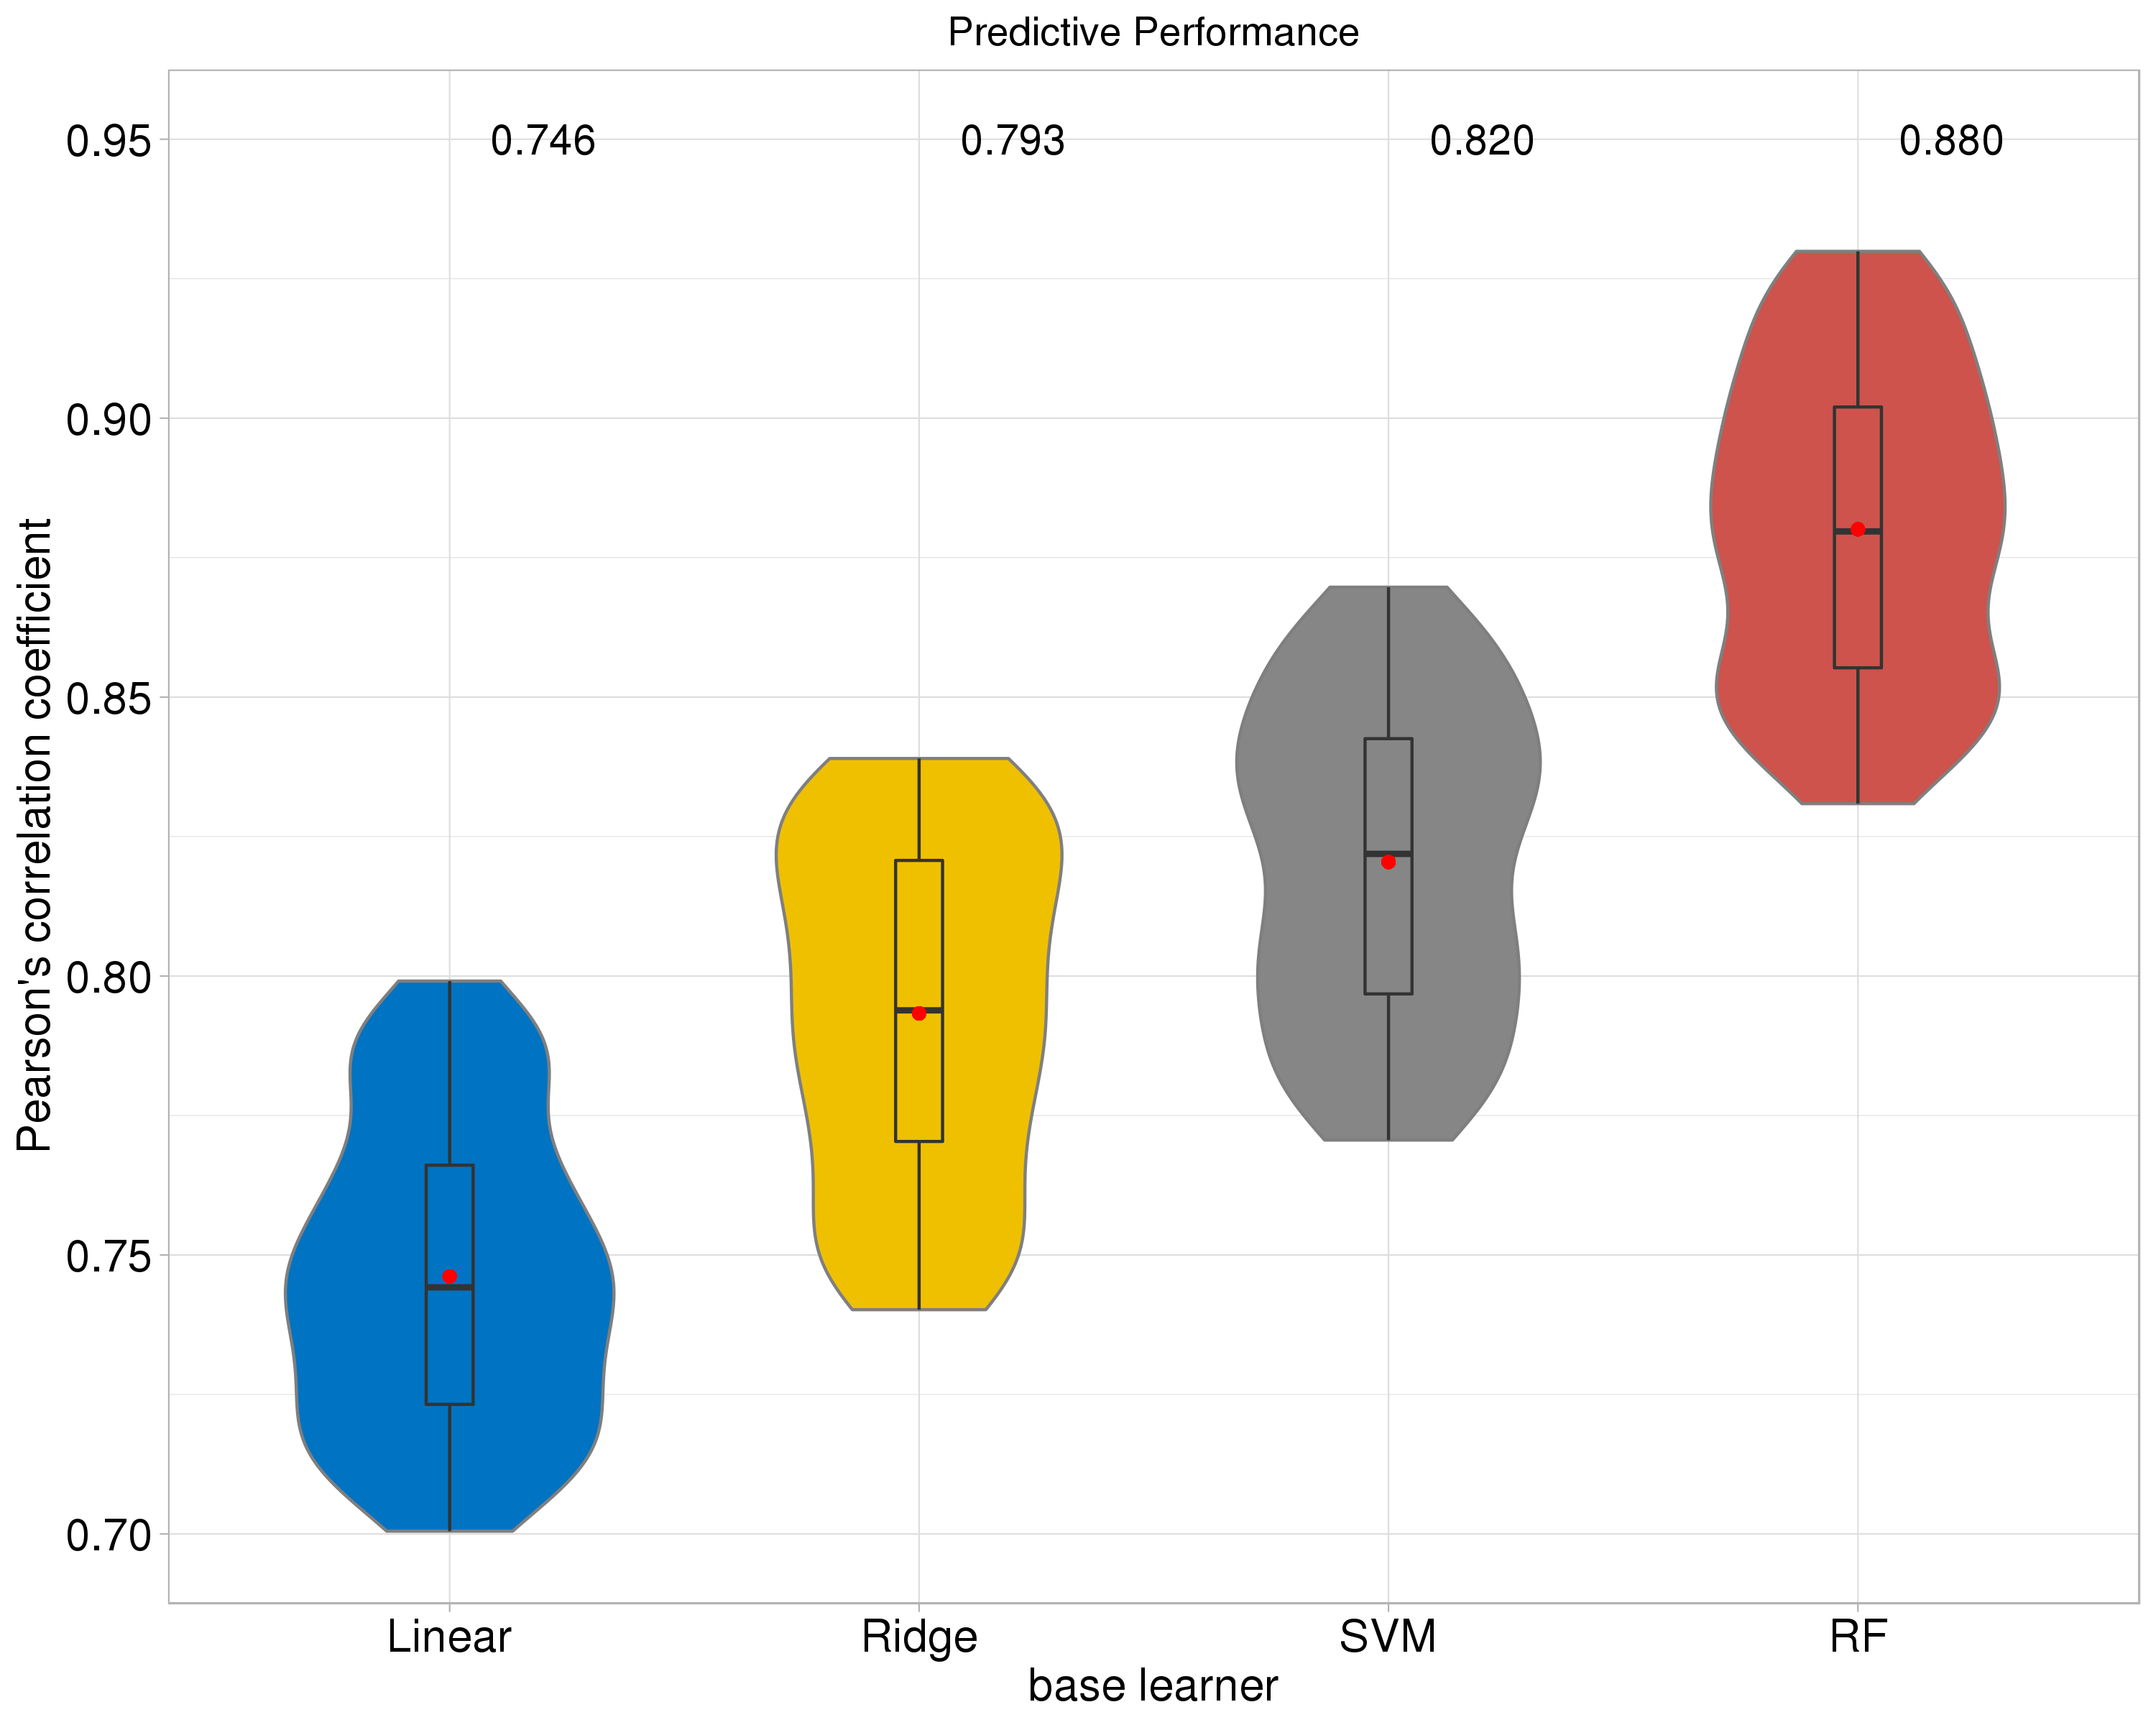
input data
| value | model | |
|---|---|---|
| 1 | 0.73 | Linear |
| 2 | 0.76 | Linear |
| 3 | 0.79 | Linear |
| ... | ... | ... |
| 99 | 0.74 | Linear |
| 100 | 0.79 | Linear |
| 101 | 0.81 | Ridge |
| 102 | 0.82 | Ridge |
| 103 | 0.75 | Ridge |
| ... | ... | ... |
code
output
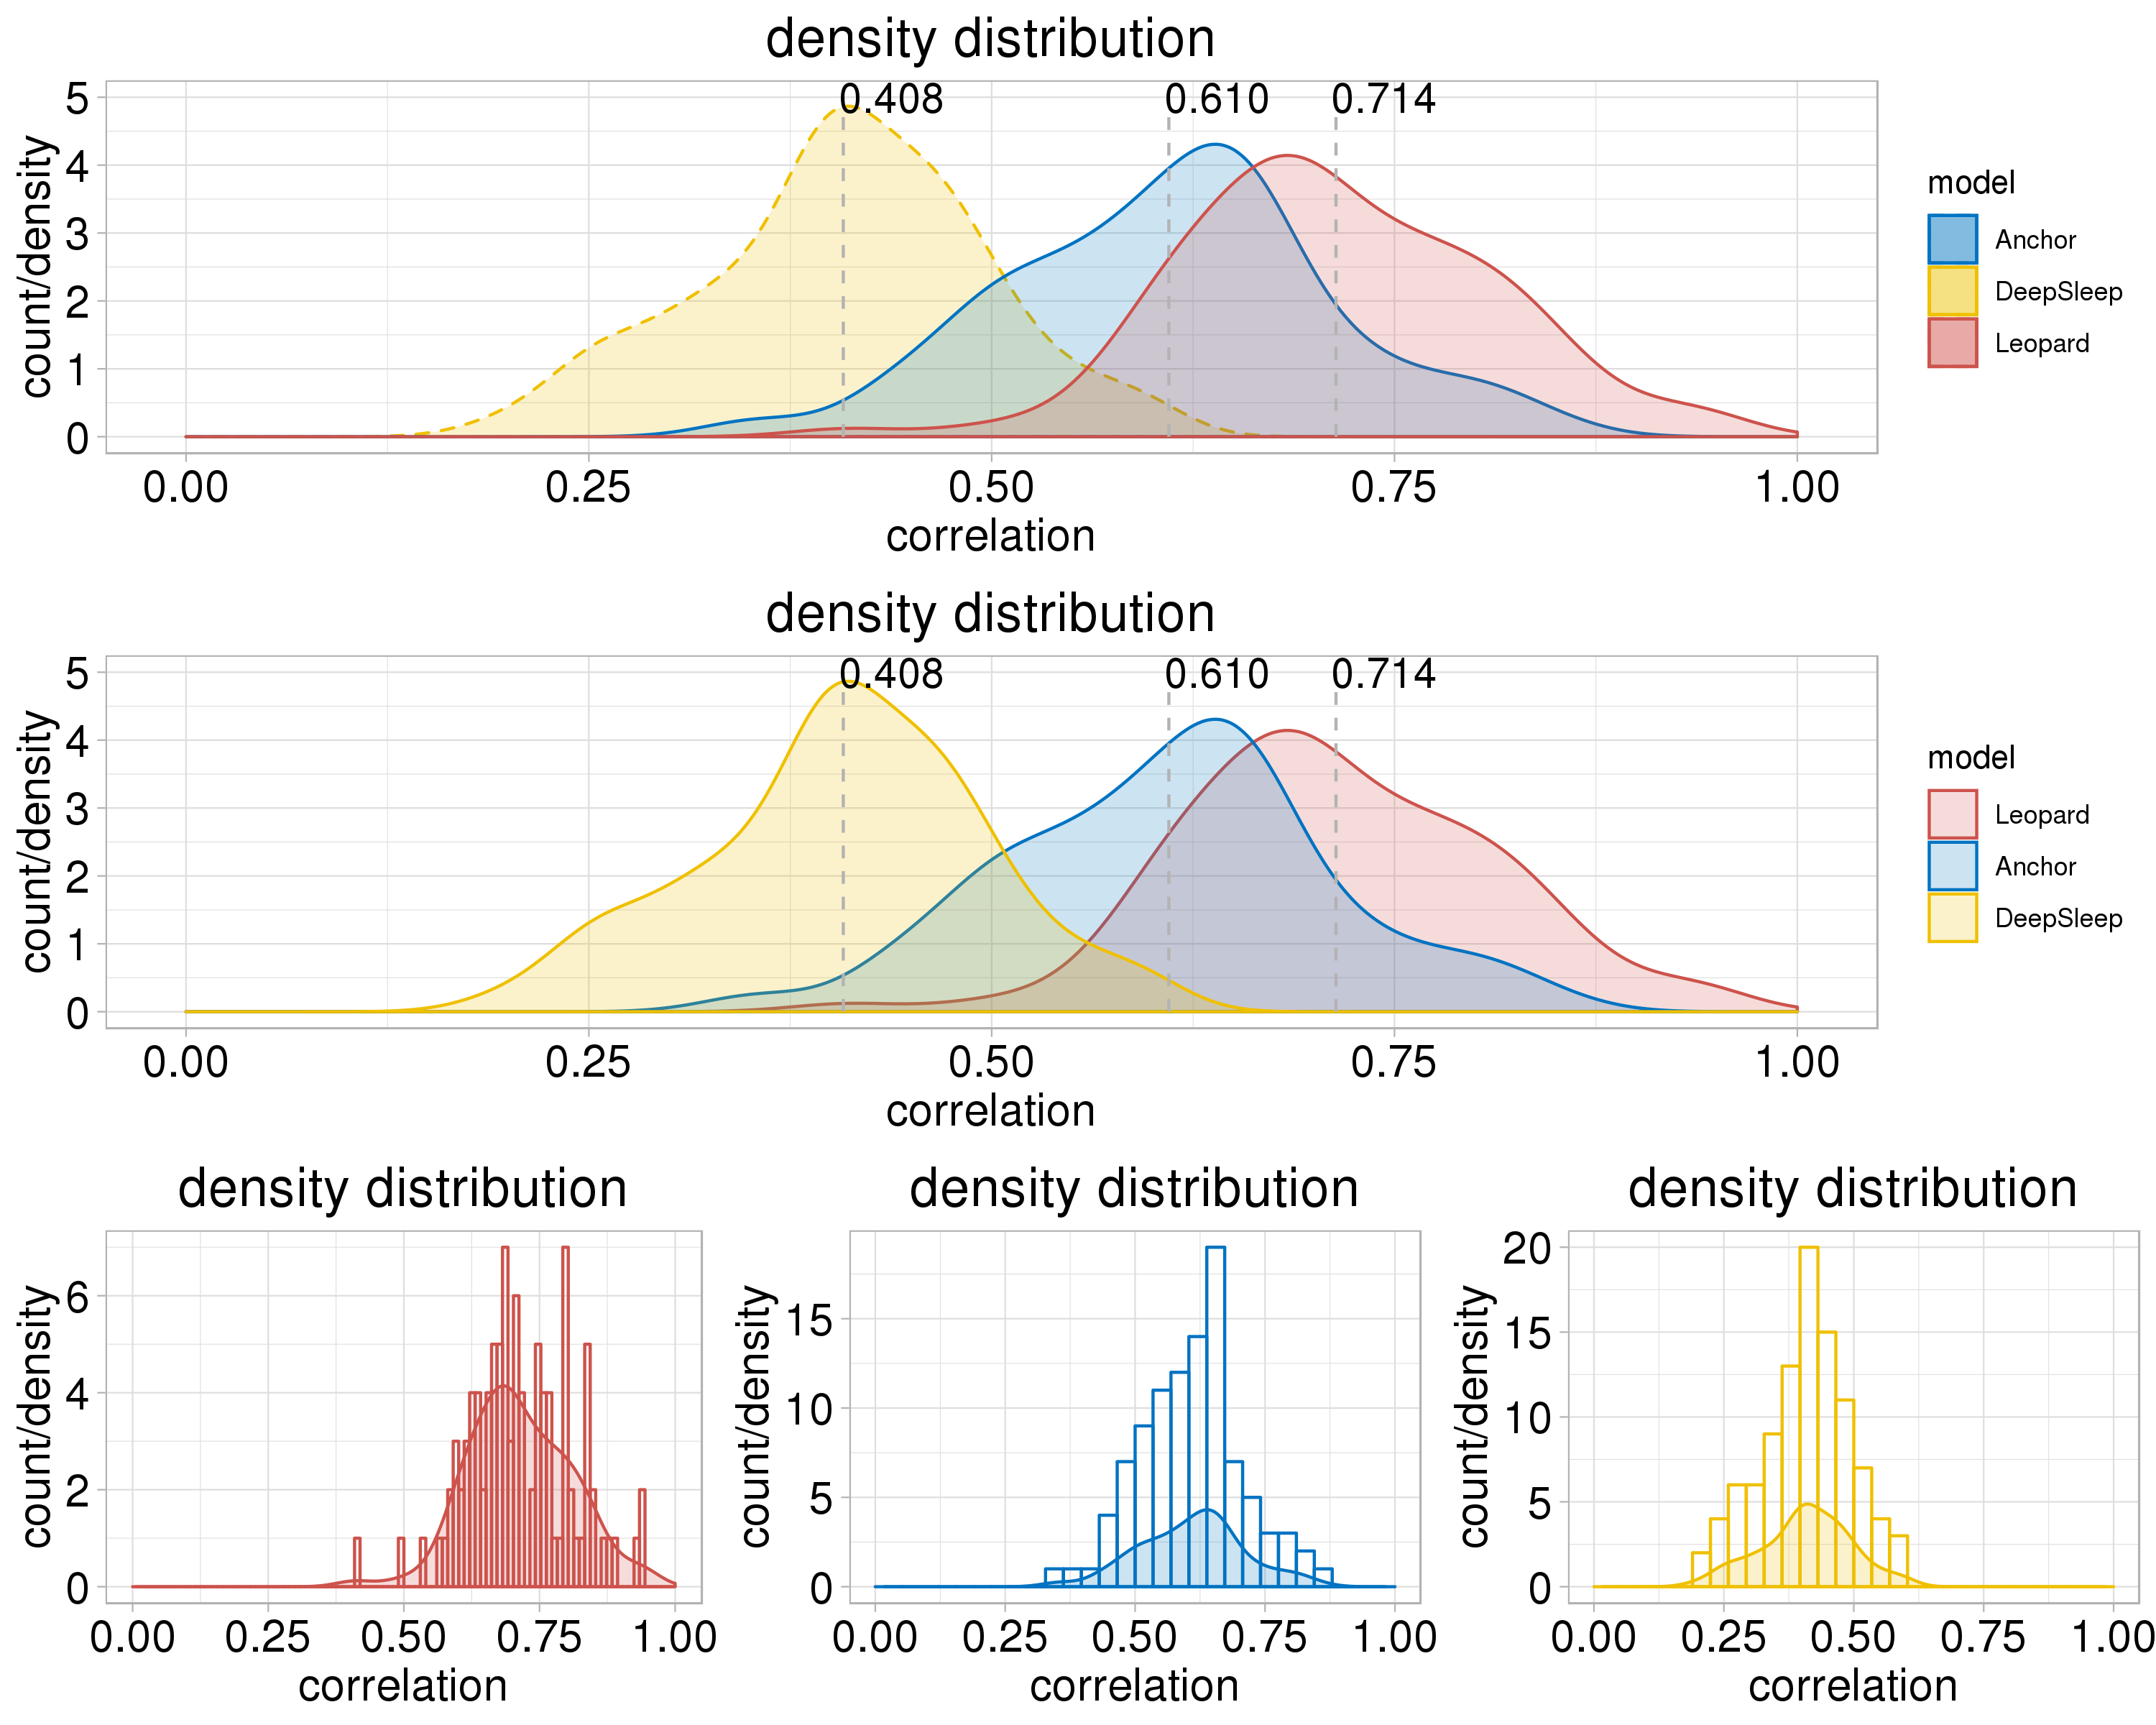
input data
| value | model | |
|---|---|---|
| 1 | 0.66 | Leopard |
| 2 | 0.81 | Leopard |
| 3 | 0.63 | Leopard |
| ... | ... | ... |
| 99 | 0.88 | Leopard |
| 100 | 0.67 | Leopard |
| 101 | 0.72 | Anchor |
| 102 | 0.59 | Anchor |
| ... | ... | ... |
code


