GPU is an expensive resource, and deep learning practitioners have to monitor the
health and usage of their GPUs, such as the temperature, memory, utilization, and the users.
This can be done with tools like nvidia-smi and gpustat from the terminal or command-line.
Often times, however, it is not convenient to ssh into servers to just check the GPU status.
gpuview is meant to mitigate this by running a lightweight web dashboard on top of
gpustat.
With gpuview one can monitor GPUs on the go, though a web browser. Moreover, multiple GPU servers
can be registered into one gpuview dashboard and all stats are aggregated and accessible from one place.
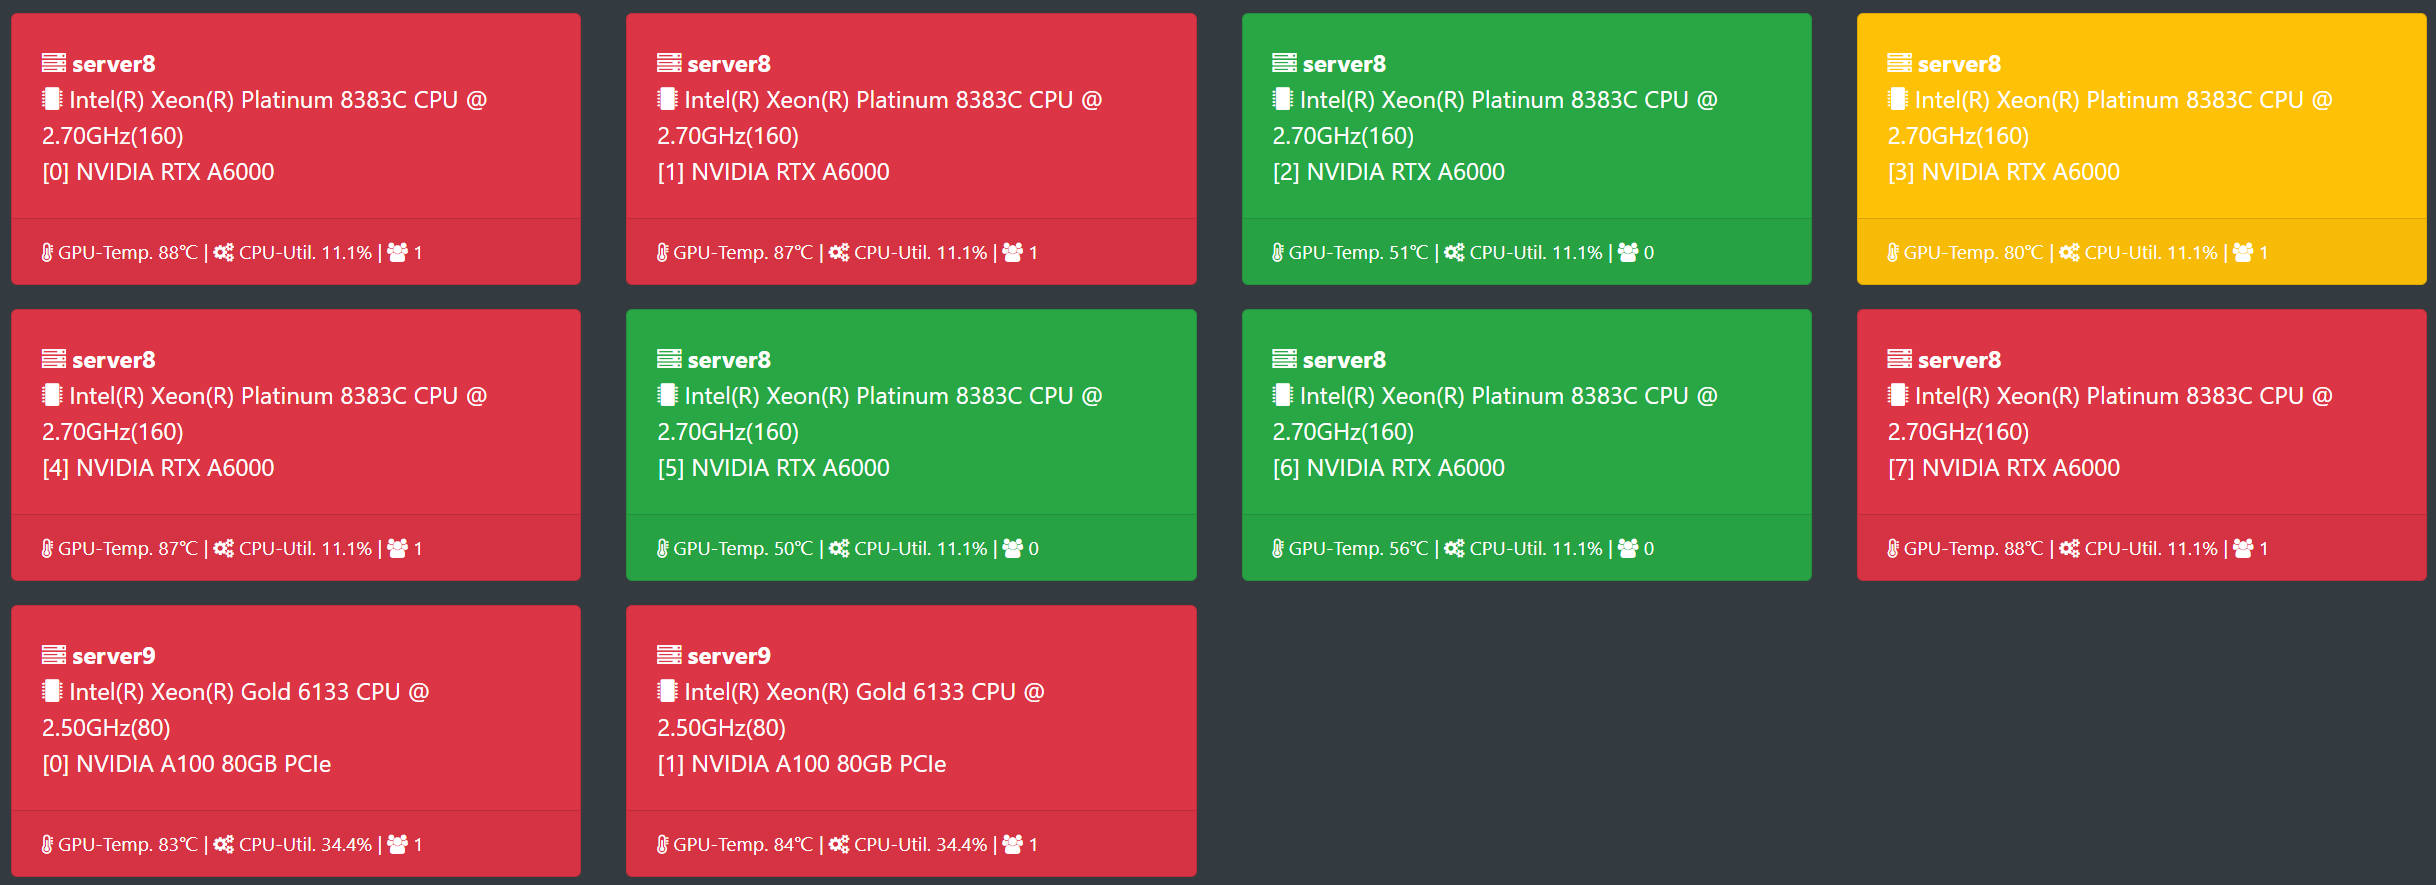
Thumbnail view of GPUs across multiple servers. On top of the existing structure, the card section will additionally display the CPU model (logical core count), and at the bottom, it will show the host CPU usage and the number of processes on the GPU.
gpuview can be used in two modes as a temporary process or as a background service.
Once gpuview is installed, it can be started as follows:
$ python3 gpuview/app.py run
This will start the dasboard at http://0.0.0.0:9988.
By default, gpuview runs at 0.0.0.0 and port 9988, but these can be changed using --host and --port.
To permanently run gpuview it needs to be deployed as a background service.
This will require a sudo privilege authentication.
The following command needs to be executed only once:
$ python3 gpuview/app.py service
If successful, the gpuview service is run immediately and will also autostart at boot time. It can be controlled using supervisorctl start|stop|restart gpuview.
There a few important options in gpuview:
run: Startgpuviewdashboard server--host: URL or IP address of host (default: 0.0.0.0)--port: Port number to listen to (default: 9988)
add: Add a GPU host to dashboard--url: URL of host [IP:Port], eg. http://192.168.0.8:9988--name: Optional readable name for the host, eg. Node101
remove: Remove a registered host from dashboard--url: URL of host to remove, eg. http://192.168.0.8:9988
hosts: Print out all registered hostsservice: Installgpuviewas system service--host: URL or IP address of host (default: 0.0.0.0)--port: Port number to listen to (default: 9988)
To aggregate the stats of multiple machines, they can be registered to one dashboard using their address and the port number running gpustat.
Register a host to monitor as follows:
$ python3 gpuview/app.py add --url <ip:port> --name <name>
Remove a registered host as follows:
$ python3 gpuview/app.py remove --url <ip:port> --name <name>
Display all registered hosts as follows:
$ python3 gpuview/app.py hosts
Note: the
gpuviewservice needs to run in all hosts that will be monitored.
Tip:
gpuviewcan be setup on a none GPU machine, such as laptops, to monitor remote GPU servers.
Helpful tips related to the underlying performance are available at the gpustat repo.
For the sake of simplicity, gpuview does not have a user authentication in place. As a security measure,
it does not report sensitive details such as user names by default.
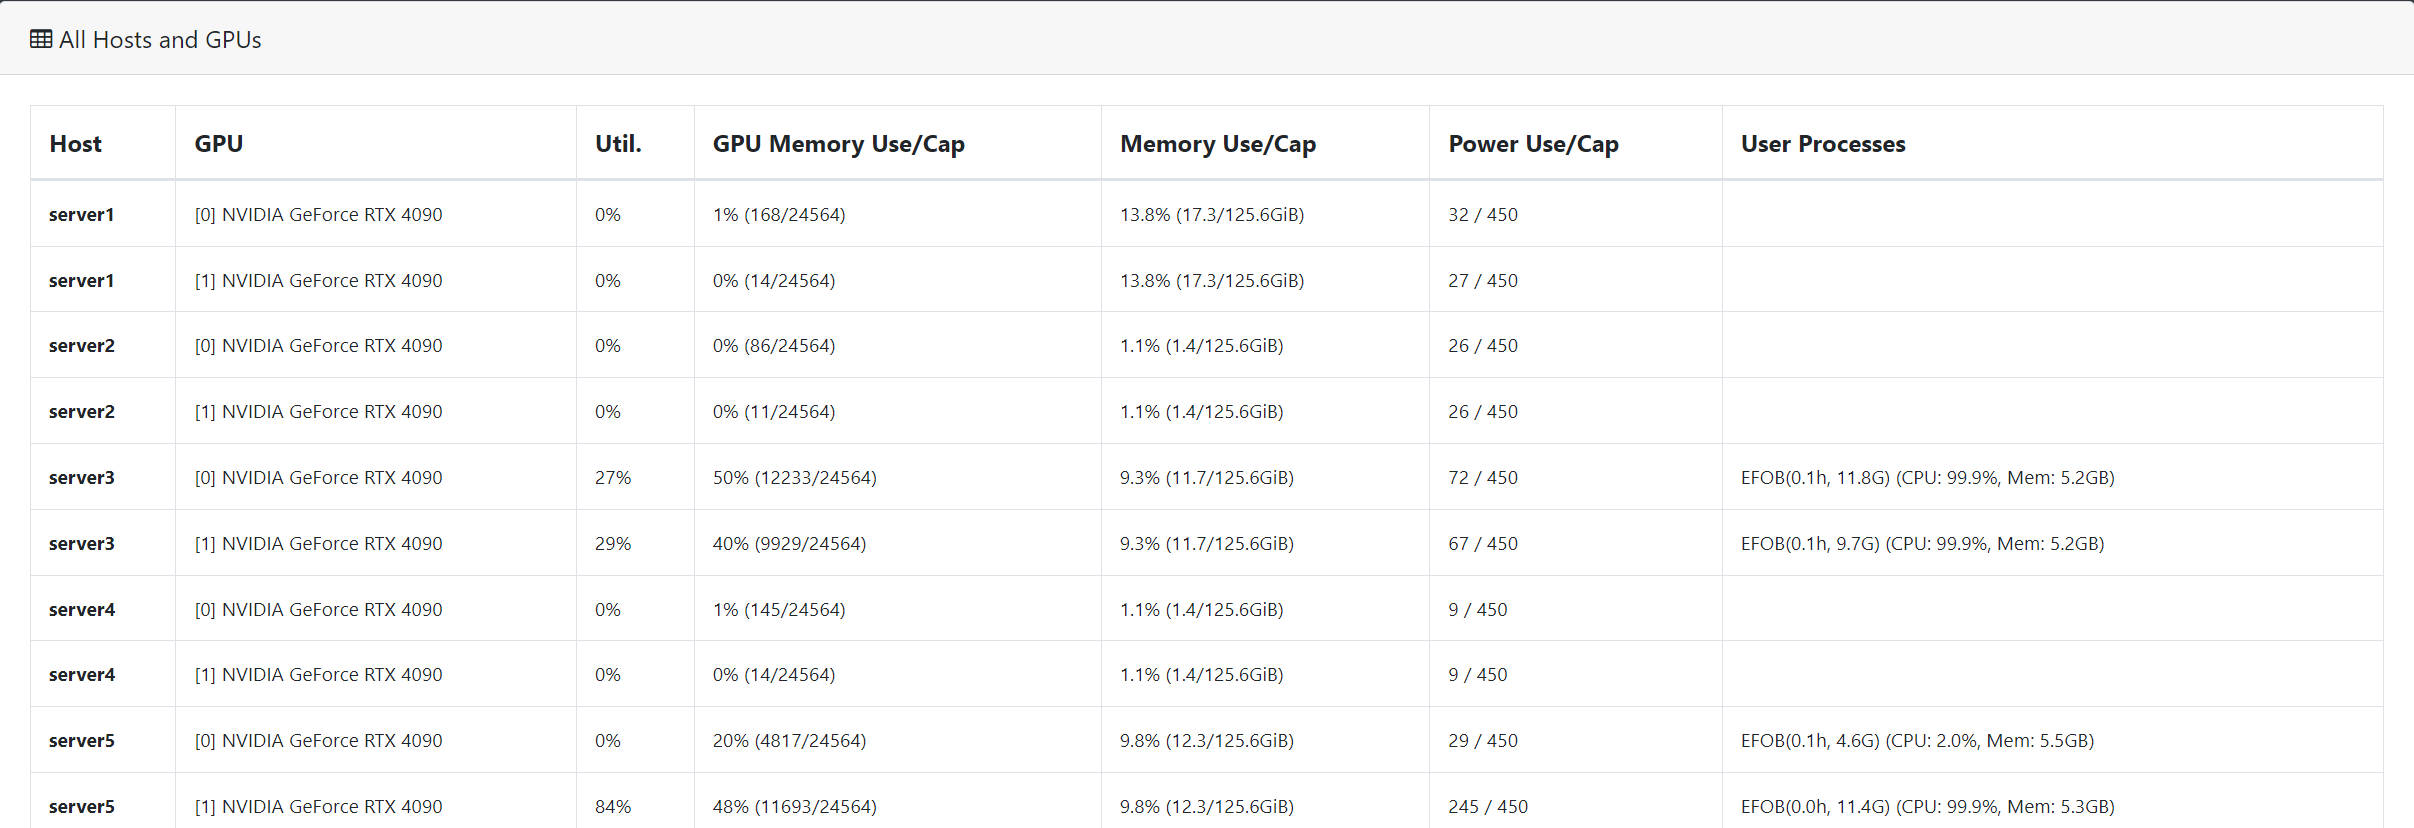
Detailed view of GPUs across multiple servers. Added the host memory usage information and filtered out processes running inside Docker containers in the last column (to meet our team's requirements, see relevant code in gpuview/core.py). Also displayed elapsed time, GPU memory usage, CPU usage, and memory usage.


