You might consider creating a conda or other python venv with some recent version of Python (>=3.9) to install the Python package and dependencies. There are two ways to get started:
-
Use
pipto install into your Python environment:- To get a released version from PyPI:
pip install aiu-trace-analyzer - For direct use from the repo or developer use:
pip install --editable . - Building a wheel first and then install the wheel file via
pip:python -m build --wheel
To uninstall run
pip uninstall aiu-trace-analyzer - To get a released version from PyPI:
-
The rather manual alternative would be to install the dependencies from
requirements.txtand set thePYTHONPATHvariable:export PYTHONPATH=${PYTHONPATH}:${PWD}/srcThis option requires you to replace any
acelyzercommand withpython bin/acelyzer.pyin the subsequent documentation.Note: only
numpyis strictly required.pytestwould be needed to run tests.perfettois necessary in case you plan to ingest perfetto protobuf files. This is experimental and only a subset of events and metrics are implemented.
The main command line tool is: acelyzer (which stands for AIU Trace Analyzer). If you installed via pip, acelyzer can be run directly instead of python acelyzer/acelyzer.py.
The -h option should provide initial and most up-to-date clues about the available command line parameters.
For a quick functional test you can run:
acelyzer -i tests/test_data/basic_event_test_cases.json
This should produce an output file: processed_trace.json (see here for details about the output).
The input can be either a single json file, a comma-separated list of files or file patterns. Note that if you use a file pattern, it has to be quoted to prevent the shell from expanding the pattern before input.
The following command will collect all json files of a HAP model run and combine them into hap_trace.json also adds counters for utilization and power and a few summary csv files prefixed by the file name. (Note: the input file argument is just an example for a wildcard pattern using quotes to avoid shell expansion, the trace files are not part of this repository).
The -c argument provides the tool with the log file which is being processed for additional context information to compute utilization and kernel categories.
acelyzer -i "${TRACE_DIR}/hap-json-files/hap-bs8-seq256-autopilot-0-34707-job-*.json" -c ${TRACE_GIT}/hap-json-files/hap-bs8-seq256-autopilot-0.log -o hap_trace.json
An evolving feature is the use of processing profiles (option -P) to allow control which processing stages are enabled. By default, the everything.json profile is used. Note that the cmdline still overrides the deactivation of stages so that if a stage is not requested via cmdline, its activation in the profile has no effect. When creating a profile, it's currently necessary to start from the everything-profile and set unwanted stages to false.
The tool is capable of ingesting these types of input files:
- json traces: So far this is the primary and supported option. It can be a json file that contains a list of events or another trace file that's formatted after the Trace Event Format. The tool is also capable of processing torch profiler trace files. It attempts to detect the input 'dialect' and adjusts event treatment accordingly.
- perfetto protobuf files: so far it's able to extract trace events and their arguments from those files. It's not reading counters or other more sophisticated things yet (limited functionality).
There's a basic autodetect function for the file type built in. If the filename extension doesn't indicate the type, it detects log files by their lines with time stamps, it detects json files by finding the initial open parenthesis, and for everything else, it assumes binary format of perfetto.
The outputs from running Acelyzer include several files, providing insights into AIU performance and execution. Below is a description of each file and its primary use, assuming the output name given to the Acelyzer run is out.json:
-
<name>.json(the filename defined by the-ooption orprocessed_trace.jsonby default) is a JSON file that can be loaded into common performance-tracing viewing tools like Chrome, Perfetto or TensorBoard. See this Section for some details about these tools. -
<name>_summary.csvprovides a function profile of execution time and occurrences of device-residing computation kernels. -
<name>_categories.{csv,txt}provide a breakdown of execution times over a handful of categories of kernels, where different categories representing different types of computation operations on AIU. Kernel categories are implicitly documented in DeepTools’ compilation log (the Perf Summary table in the stdout log files associated with a profiling run). For example, thebmm*category performs matrix operations using the PT-arrays in AIU’s Rapid-Cores, while other categories are primarily responsible for vector computations that do not involve the PT-array.
Table: Available Performance Metrics/Views
| Metrics/Features | Description | Details |
|---|---|---|
| Power | Device power consumption per computation AIU-kernel function | Accurate for autopilot-off profiling mode |
| PT active % | Utilization of PT-array in the Rapid-cores per computation AIU-kernel function | Accurate for autopilot-off profiling mode, need redundant run to be effective for autopilot-on mode. |
| ConcurrentPrep | Number of overlapped computation AIU-kernel functions that are in the preparation stage, indicating the loads to the AIU request queue. | Useful for autopilot-off profiling mode |
Non-device activity in FLEX |
CPU-residing functions defined in AIU-runtime (FLEX) |
|
| Multi-AIU trace view | Timelines of CPU and AIU events from multiple ranks of a multi-AIU workload | Available for autopilot-on mode |
| Multi-AIU distributed view | Breakdown analysis of elapsed times of computation and communication of a multi-AIU workload | Available for autopilot-on mode via TensorBoard |
| Kernel time breakdown by categories | Breakdown of execution times over a handful of categories of kernels, where different categories representing different types of computation operations on AIU | Available in text and csv format for autopilot-off profiling mode. Additional run to support autopilot-on mode. |
| Kernel time breakdown | Function profile of execution time and occurrences of device-residing computation kernels | Available in text and csv format for autopilot-off profiling mode |
| Elapsed time per inference iteration | Averaged elapsed time of an inference iteration | Available in console output for autopilot-off profiling mode, only if autodetection succeeded |
Acelyzer creates basic kernel profile statistics in the output file named <name>_categories.{txt,csv}. It's created in txt and csv format for consumption by either human inspection or subsequent processing respectively.
This is important to help growing developers on kernel definition, kernel auto-generation, and other
POWER users who are interested in expanding the observation scope around and below the AIU kernel execution.
 Pid      Category   Cycles  Frac_Cycle  Calls  Cycles(core)  Ideal_Cyc  Frac_Ideal  PT_Util
   0         other   525920      0.0081    660        701497          0         0.0   0.0000
   0     LayerNorm   544701      0.0084   2205        726548          0         0.0   0.0000
   0     Broadcast   635528      0.0098   2565        847698          0         0.0   0.0000
   0      Bmm_fp16 59001600      0.9093   2895      78699230   18061203         1.0   0.2295
   0         Total 64885331      1.0000  19020      86547239   18061203         1.0   0.2087
There are 3 types of time stamps synchronization involved:
- Mapping of host timestamps and cycles extracted from the device
- Synchronization between the event streams when multiple devices are used e.g. when doing Tensor Parallel computation
- When providing a mix of Flex and Pytorch traces, the 2 types of inputs get aligned along specific event names. This also requires the Flex jobs and the Torch profiler iterations to match since there's currently no other reference to allow correct mapping.
When running acelyzer, the progress and basic processing information is printed to the console. This includes information about the input/output files and events as well as essential warnings and errors. The event processing is happening in stages and each stage has a short identifier like OVC (overflow correction) or PEC (power extraction and computation), etc. This helps to identify problems and categorize any warnings. It is recommended to pay some attention to the warnings before diving into further analysis or visualization because they can point to certain problems with the input or output data which may render useless the visualized data. For example if the tool detects an effective frequency that wildly differs from what's used on the cmdline, your event durations and timestamps could be unrealistic/unreliable. More about this can be found in the troubleshooting section.
This section explains some of the command line options in more detail.
This option allows to pass the compiler log output into acelyzer and allows for additional data augmentation and PT-Array utilization data. For multi-AIU workloads, one file per process should be provided to avoid intermingled data inside the log. Also it is important that multi-AIU logfiles be provided in the order of the process ranks to properly map each log file to its rank.
For multi-AIU workloads, this option enables a detection of communication calls and collective operations.
Limitations:
- It strongly depends on the available flex data and might just not be able to find communication primitives or the necessary information to correlate sends and receives to establish flow events.
- If collective events are not detected, it also prevents computation of collective bandwidth and the distributed view data in TensorBoard.
This feature relies on successful flow detection to create an event stream where each event spans the duration of collective operations and allows for computation of effective bandwidth for these collectives. This can be useful for analysis of distributed workloads.
Somewhat similar to build_coll_event, but doesn't require flow detection. It creates a communication event for each detected pair of send-receive events. This is useful to increase the visual comprehension of communication steps and reduce the amount of events for cases where a single send or receive operation consists of multiple sub-steps.
Acelyzer is attempting to detect cycle-to-wallclock mapping differences between jobs of the input. There are 2 problems that it tries to address:
- if the AIU events are shifted outside of the corresponding AIU-Roundtrip event: In this case, there's a per-job (and rank) offset that's calculated between the first AIU event and the AIU-Roundtrip event.
- if the AIU events duration is longer than the corresponding AIU-Roundtrip event: In this case, there's a frequency or a gap issue that might or might not be fixable
- if these offsets exhibit an increasing drift from one job to the next, it's attempting to recommend a frequency setting that better fits the data
Associated warnings in the output:
<timestamp> WARNING FREQ: job: ('<filename>', -567744.0729999542) has AIU events outside of corresponding CPU range. Attempting to fix might cause unreliable data.
Consequences when in use:
- the first AIU event of each job will be force-aligned to the corresponding AIU-Roundtrip
- it assumes the CPU timestamps as the ground truth for alignment (this assumption might be wrong)
- this can only be a rough alignment because of lack of additional information
- the same offset is applied to all events of a job
- the amount of adjustment is added to the event metadata, so have immediate information that the event was shifted and by how much.
This option replaces the individual events of a Flex communication with a single combined send or recv event spanning the time of the separate items. While this removes detail from the result, it reduces 'clutter' and allows better visual clarity to follow a communication protocol at a higher level.
Consequences when in use:
- removes detailed sub-steps that show when and how interactions with the host appear
- spans the entire time from posting of the communication to the completion, this can exaggerate communication time e.g. if a recv is posted early for later completion
This option allows to set the SoC and Ideal frequencies if they differ from the default. Right now, we're not scanning a potential log file for this data and thus rely on the user to provide the information.
- SoC frequency is setting the frequency that was used for the cycle counter in the flex events. It is essential to get it at least roughly correct to prevent misaligned AIU-CPU events.
- core frequency is setting the frequency that was used to calculate the ideal cycles that is placed in the compiler log file. This value is used to compute the utilization of the core PT array by compute kernels that have a non-zero value. If it is not matching the core frequency, it causes the PT array utilization to be miscalculated or cause errors when utilization of >100% is the result of a too-low frequency.
If acelyzer detects a consistent effective frequency for events, it will provide a suggestion like:
<timestamp> WARNING FREQ: Recommendation: to minimize event time drift (max: -333833us) between CPU and Accelerator, use: --freq=899.577
This suggestion will only appear for drift between jobs and thus requires at least 2 jobs at the input.
An additional set of frequency statistics computes min/mean/max observed frequencies based on individual event duration and event intervals between subsequent compute events. Therefore, it's working for single-job flex traces too. The corresponding output looks like this:
<timestamp>  WARNING FREQ: Detected Event-duration-based frequency (min/mean/max): <x> <y> <z> ; rel_range=0.023, input_soc_freq/detected=2.08
<timestamp>  WARNING FREQ: Detected Event-interval-based frequency (min/mean/max): <x> <y> <z> ; rel_range=0.012, input_soc_freq/detected=2.09
The rel_range number shows how narrow/wide the window of detected frequencies was.
A narrow window indicates consistent trace data with well-calibrated cycle-to-clock conversion.
The ratio of input_soc_freq/detected helps to determine whether the soc-freq setting on the cmdline was reasonably close to the reality of this trace.
In best case, the relative range should be close to 0.0 and the input/detect-ratio is expected to be close to 1.0.
Consequences when in use:
- see here for various problems that can be caused or alleviated by this parameter
A lot of things are asynchronously processed and the corresponding events are not possible to view as a proper call stack in either of the 2 viewers (chrome, perfetto). The tool provides 3 options via -O nnn argument to resolve situations where events overlap in that way:
- increase the thread ID to separate
tid(default, recommended) - drop conflicting events
drop(intended for debugging and not recommended) - convert some events into asynchronous events
async(deprecated, incomplete implementation of subsequent processing stages and thus not recommended to use)
By default, so-called prep events are removed from the view and represented as a counter (ConcurrentPreps) that shows how many of these events are active at a given time. This option tells acelyzer to keep the events as visible events in their thread.
Consequences when in use:
- adds a (potentially) large amount of events to become visible that are also often overlapping
- nothing negative other than the increased number of events
Sometimes the input data results in strange results. Some cases are being discussed below:
This can happen when flex events within a job have hit a cycle counter overflow and the calibration was unable to compute the correct wallclock timestamps. Usually, when acelyzer detects the cycle overflow, it creates a new 'counter epoch' and associates the start time of that epoch to a matching wallclock timestamp based on the event that had the overflow. If that timestamp is miscalibrated, there's no way for acelyzer to know what the correct timestamp would be and thus re-creates the gap from the input data. You'll likely see a warning in the output like:
<timestamp> WARNING FREQ: Min/Max of detected correct frequency is >20% of mean (449.799,2119.404). This indicates some events might have been assigned to the wrong TSx epoch.
Causes other problems:
- detection of any frequency drift becomes impossible and therefore frequency suggestions will be unreliable
- detection of communication patterns becomes either unreliable or flow events are missing because they point backwards
What can be done:
- rerun the experiment can help to get a run that doesn't exhibit this issue
- filter the input files to exclude the data. For that, each event contains metadata info about the source input file, use this to identify the job number
- try option
--flex_ts_fix, although this is often unable to fix this problem (see here for details and consequences).
This can happen if the flex event timestamp-to-cycle mapping is consistent but misaligned.
Causes other problems:
- detection of communication patterns becomes either unreliable or flow events are missing because they point backwards
- hard to visually follow call stack
- hard to visually match activity on multiple ranks
What can be done:
- the option
--flex_ts_fixshould be able to alleviate this problem (see here for details and consequences). - worst case: rerunning the experiment can help
This can happen if the 'effective' SoC frequency doesn't fit the actual frequency. The AIU Flex events are based on cycle counters and the conversion from cycles to wallclock is based on a set frequency. If this frequency is slightly off, you'll see AIU events drift away from their CPU events.
You might see output warnings like:
<timestamp> WARNING FREQ: Recommendation: to minimize event time drift (max: -333833us) between CPU and Accelerator, use: --freq=899.577
Or it can cause unexpected/false event overlap along with the warning:
<timestamp> WARNING TS_SEQUENCE: detected cycles overlapping (TS3[n] < TS4[n-1]) between cmpt_exec events within the same PID 1556 / 6216 max overlap cycles: 61892
This is a common issue because timestamps are often not synchronized between AIU and processes.
Causes other problems:
- harder to follow communication
- harder to identify wait times caused by delayed communication
- flows might not be possible to detect or do not show up in the trace viewer
What can be done:
- by default, acelyzer attempts to detect collective operations and then aligns processes based on that
- if the detection fails, it can cause crashes that can be circumvented by the
-Moption - Addressing this problem is still work in progress and mostly hinges on the detection of collective operations or other potential anchors for alignment
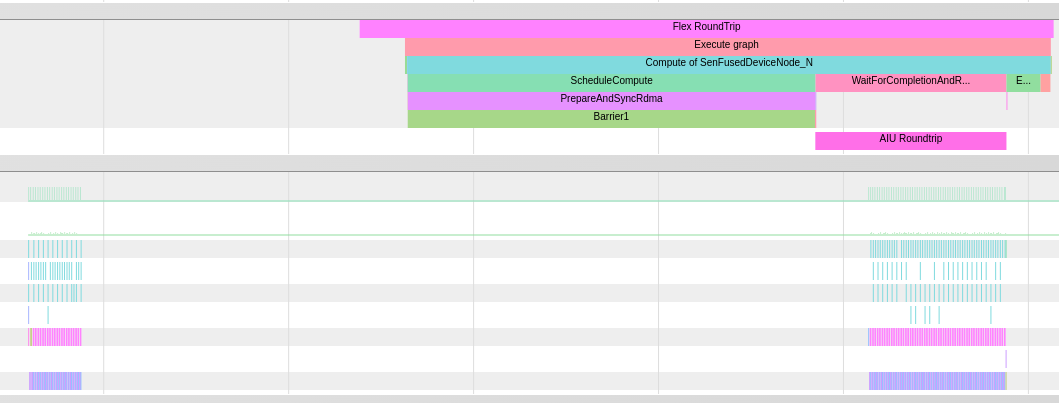
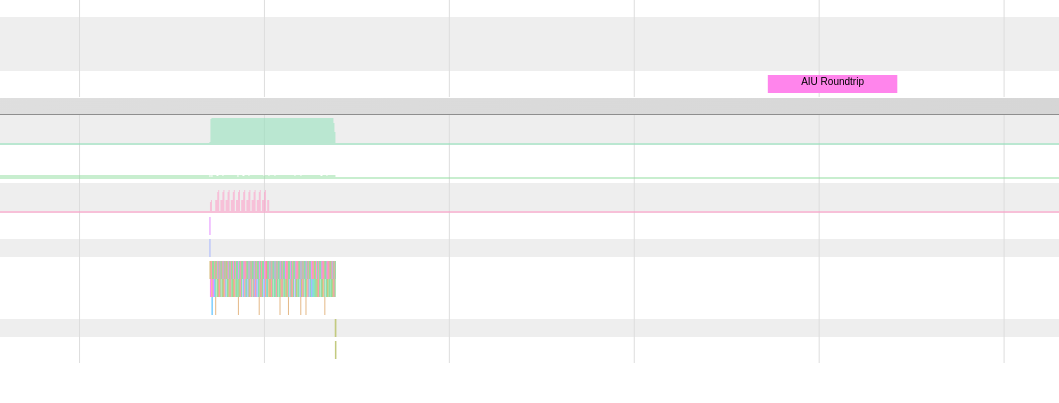
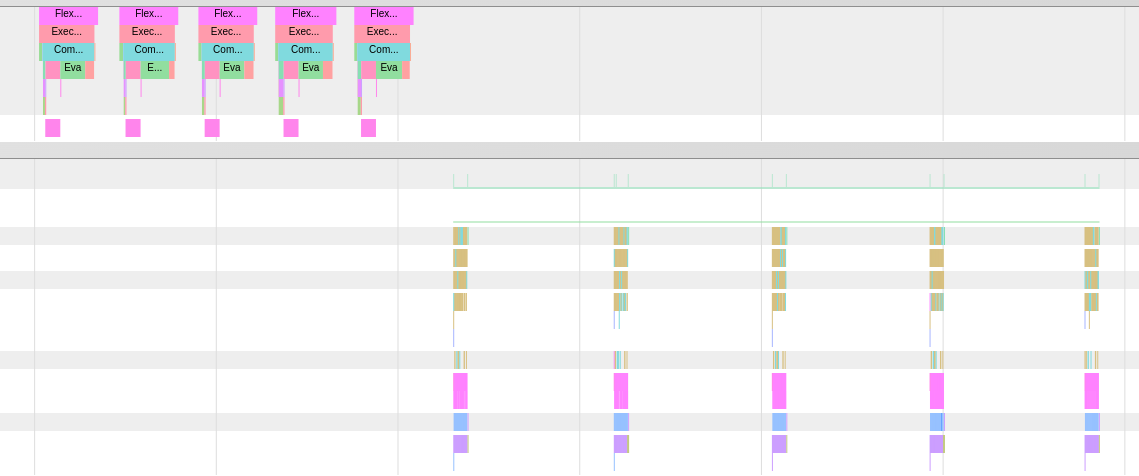
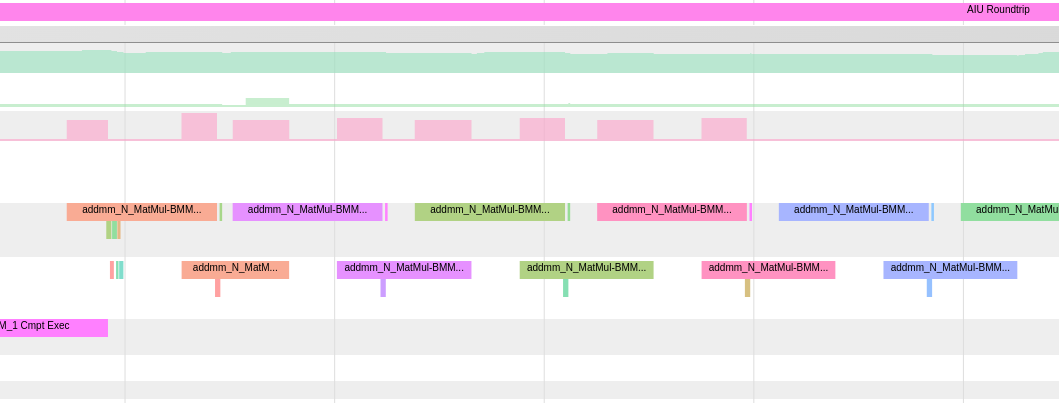
The output json file can be viewed in chrome, perfetto, or tensorboard.
-
Open url
chrome://tracingand click theloadbutton (or drag and drop the json file onto the tracing window) -
Users will find these online references useful:
TensorBoard is a standalone dashboard visualization toolkit for performance trace data in JSON format. To run on user workstation or settings with support to graphic web-browsers. Given its popularity, PyTorch has maintained a torch-profiler plugin to TensorBoard, often referred as TensorBoard-tp-plugin. Note that in this document, we often refer to TensorBoard-tp-plugin as TensorBoard for brevity.
It is necessary to install tensorboard. To get started you may check here or here.
Go to https://ui.perfetto.dev/ and select open trace file (or drag and drop the json file onto the tracing window). Note that this is an online service even if the current claim is that everything runs locally in your browser.
Details for developing new processing/filtering features for the aiu_trace_analyzer package can be found here.


