This repository holds the Python QTM Toolbox that can be used for transport measurements with equipment as used in the QTM/ICE research group.
The repository contains different files and folders, organised in the following manner:
- Measurement_script.py is the main file of the project and is the starting point of each experiment. For every new experiment, create a new copy of this file and change it to reflect your current measurement setup.
- functions contains the QTMlab.py script that contains basic functions such as move, sweep, measure.
- instruments contains definitions for all instruments that can be used during measurements.
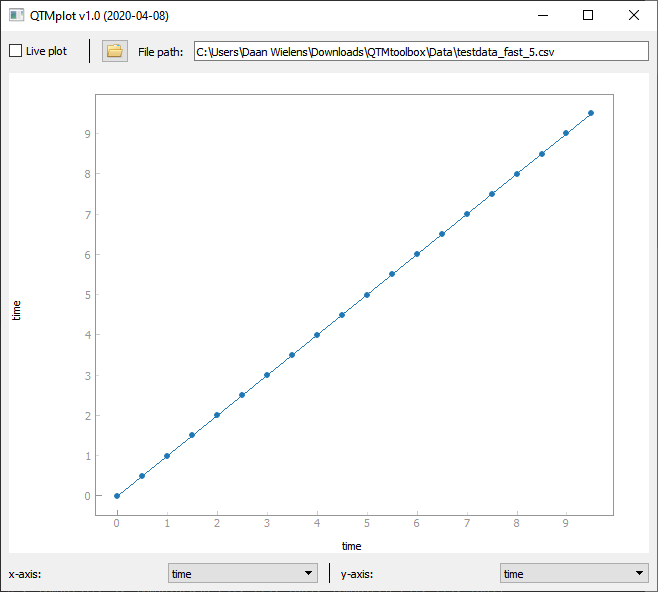
The repository contains a simple plot tool that can plot live measurements. The tool can also quickly plot other (i.e. older) data files, as long as they are generated by the QTM Toolbox.
- QTMplot.pyw is the plot tool. The tool should be launched from the pythonw.exe of your installed Python distribution.
A screenshot of the plot tool is shown below.
Tips
The plot tool has a few useful keyboard shortcuts!
- Ctrl+O : pop up the 'Open file dialog' (also stops live plotting)
- Ctrl+R : rescale figure once
- Ctrl+A : enable auto rescale: the figure will continuously rescale when new data is added through the live plotting
- Ctrl+L : toggle live plotting on/off
To run the QTMtoolbox, we recommend the installation of Python 3.x through the Anaconda distribution. To use the live plotting tool as a standalone application, tick "Add Anaconda to system PATH" during the installation of Anaconda, or edit the Environment Variables manually (see below).
By using the Anaconda prompt, install the following packages
- pyqt5
- pyqtgraph
- pyvisa
- pyserial
System environment variables: If you need to manually add the Python path to the system variables (this enables you to open cmd.exe and type 'python', which is required for the QTMplot to work as a standalone application), add the following paths. Here, we assume that Anaconda is installed in C:\ProgramData\Anaconda3.
- C:\ProgramData\Anaconda3
- C:\ProgramData\Anaconda3\Scripts
- C:\ProgramData\Anaconda3\Library
- C:\ProgramData\Anaconda3\Library\bin
- C:\ProgramData\Anaconda3\Library\mingw-x64\bin
- C:\ProgramData\Anaconda3\Library\usr\bin
A manual is supplied to help new users to setup their measurements. The manual also contains an overview of all instruments, functions, etc.
- Manual is a PDF file containing detailed information about how to use this Toolbox.
A file parser can be found in functions.qtmimport. To prevent that this file needs to be copied into every measurement folder, or that absolute paths need to be used when importing this file, it has been separated into a PyPI package as well.
To install the qtmimport package, use
pip install qtmimport
from the Anaconda prompt. Import the module either as from qtmimport import qtmimport and use as data = qtmimport.parse_data(filename) or use from qtmimport.qtmimport import * and use data = parse_data(filename).
The package can be found at https://pypi.org/project/qtmimport/
The .gitignore file tells GitLab that certain files / folder should not be uploaded to this repository (such as personal configuration files) and can be ignored.
