- Participant name: John "The King" Sermarini
- Project Title: Simulation of Moving Walkways in United States Subway Systems
The first part of this assignment explores designing models (and basic Python/Git features).
We will look at subway model in a city system. A subway system is an underground, tube, or metro, underground railway system used to transport large numbers of passengers within urban and suburban areas - modern subways use different types of electronic data collection sensors to supply information which is used to manage assets and resources efficiently.
The second part of the assignment explores data analysis. Data analysis and visualization is key to both the input and output of simulations. This assignment explores different random number generators, distributions, visualizations, and statistics. Additionally, it will look at getting you accustomed to specifying input and output variables to a system. We will also practice working with real data.
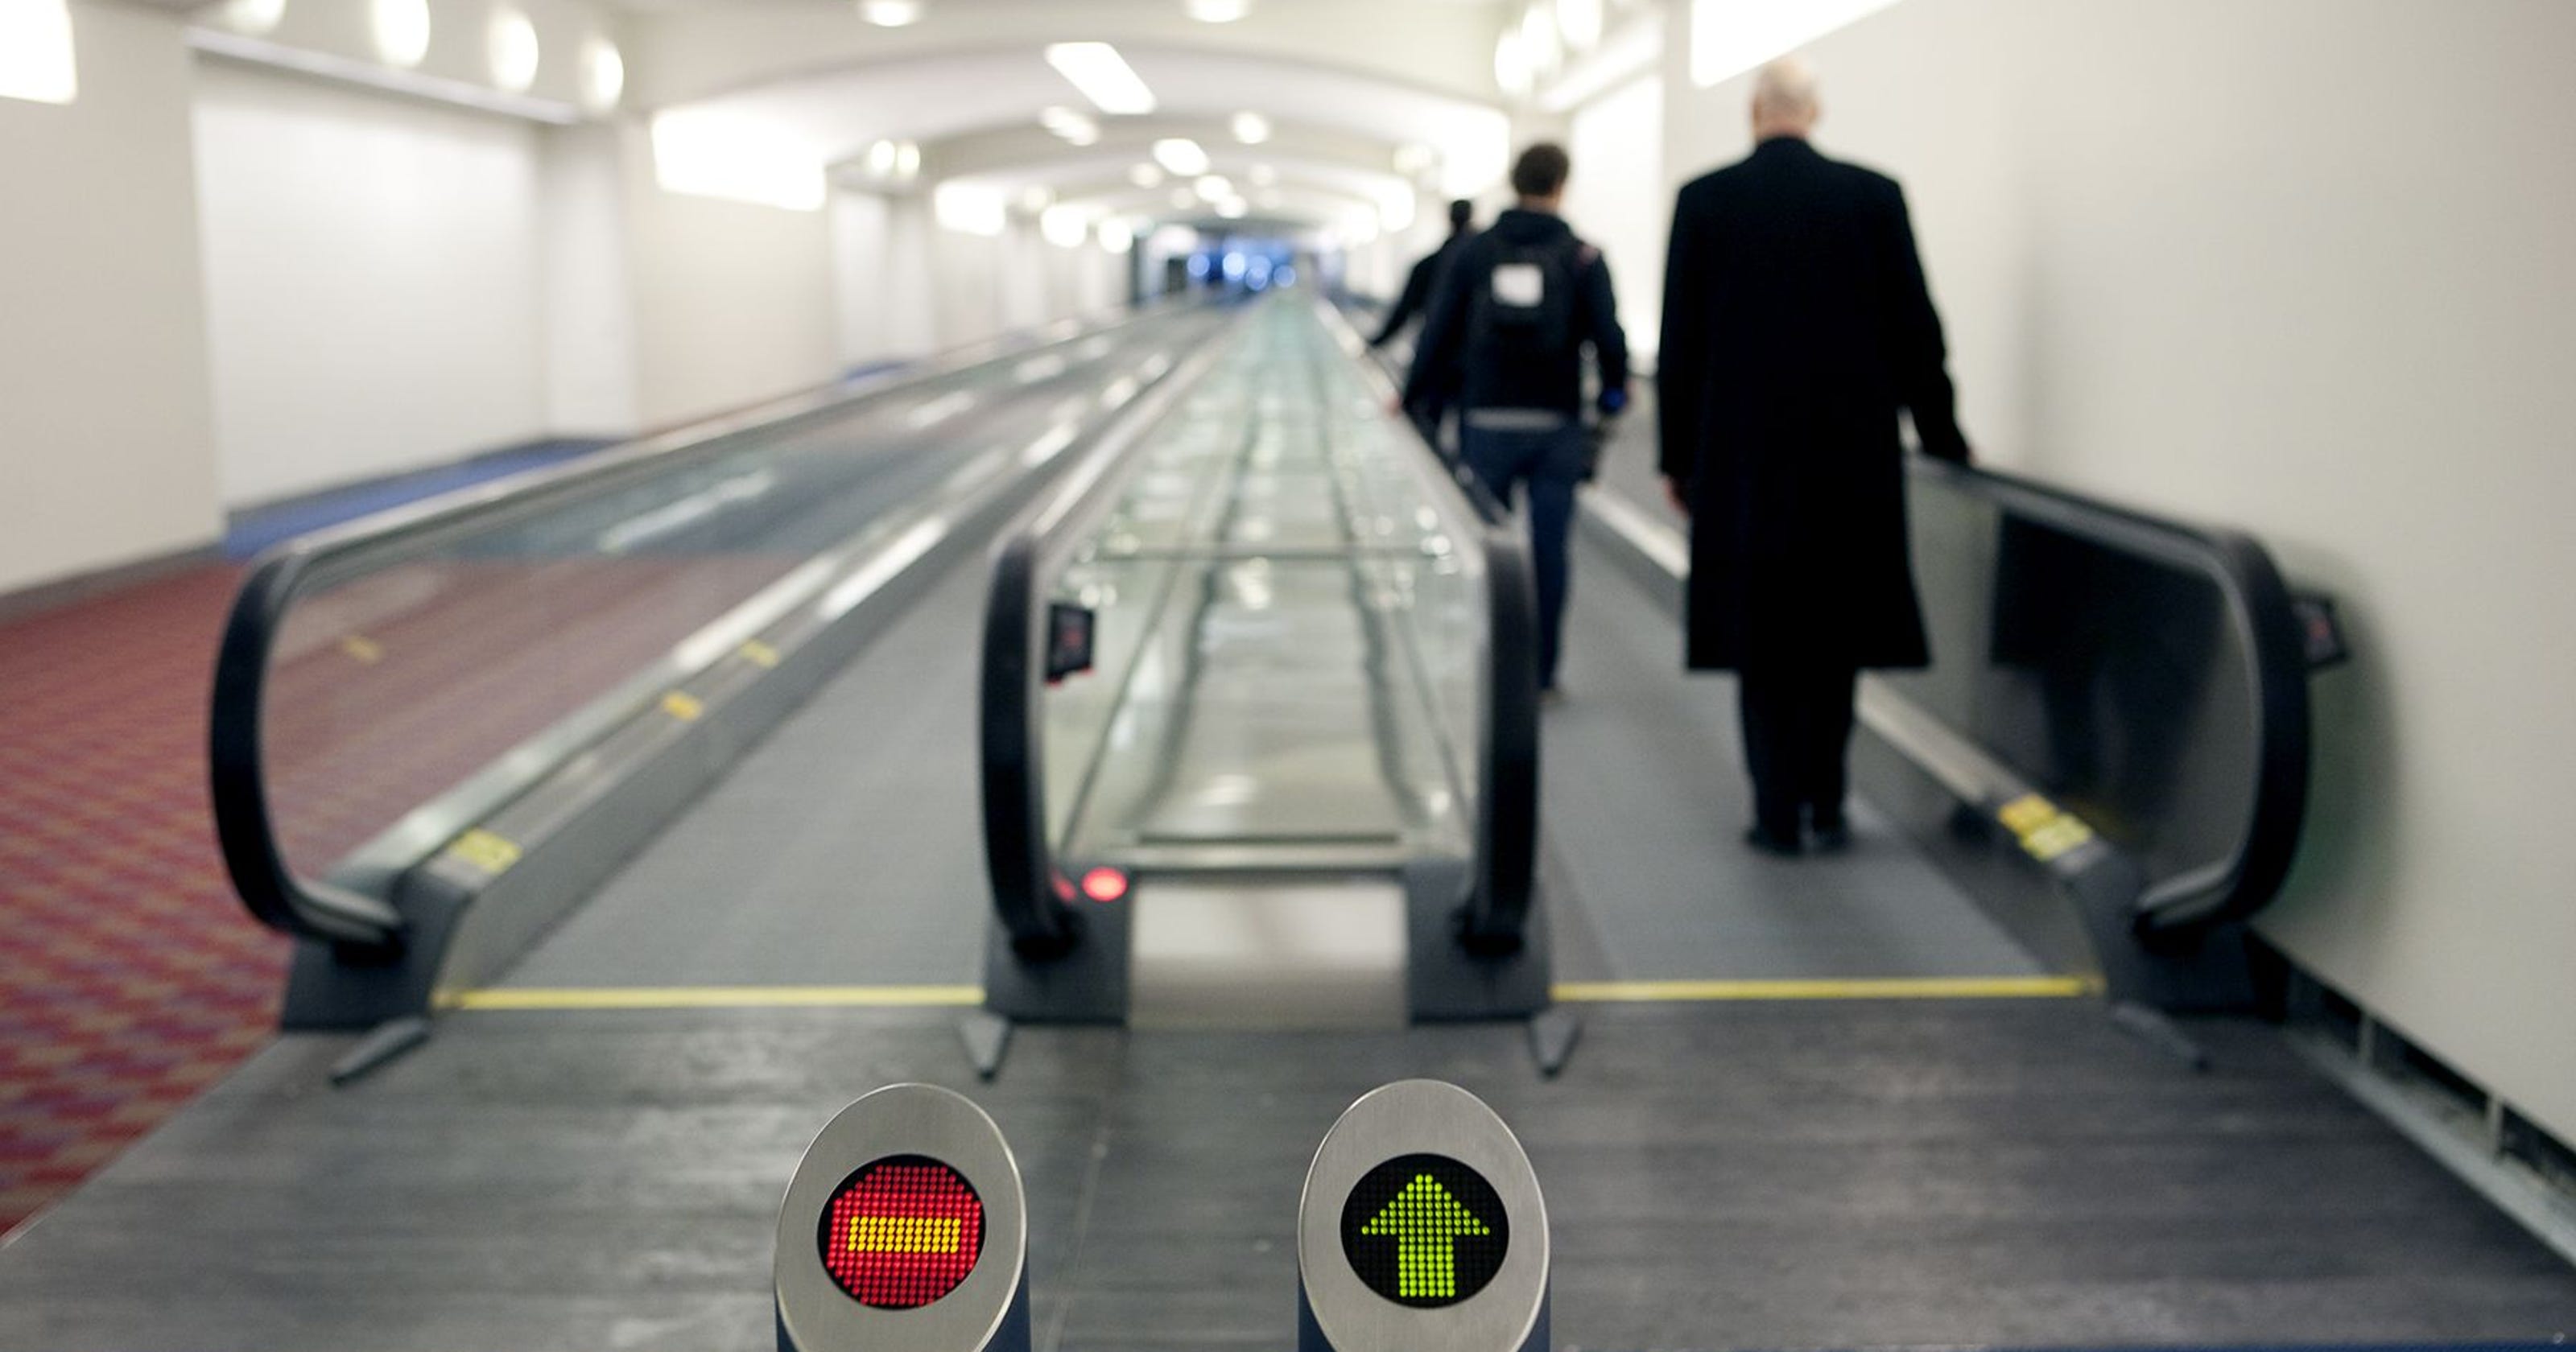
We are looking at the issue of the improving the efficiency of subway systems in the United States by introducing moving walkways to densely populated subway routes. By improving passenger movement speed, we can reduce overall time passengers spend underground which will lead to reduced congestion.
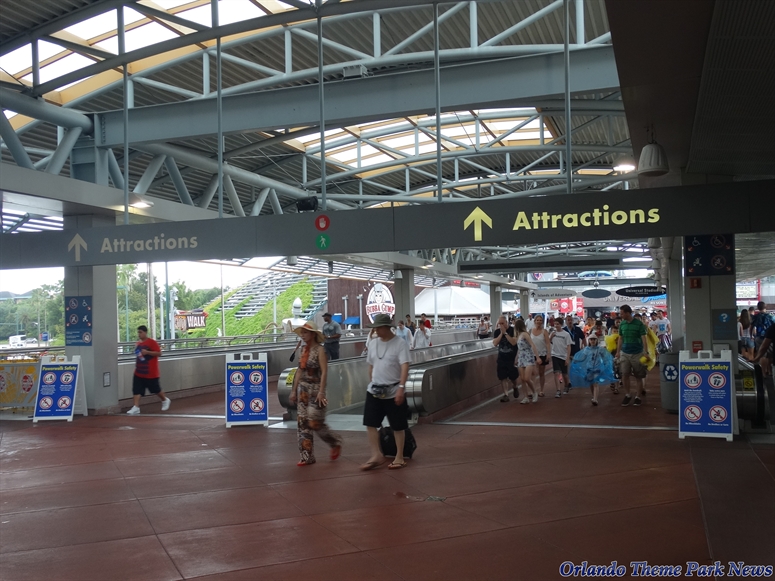
Currently, moving walkways in the United States are found mostly in airports and amusement parks, and are seldom seen within subway stations. They are more common internationally, with some notable examples being the London Underground's Bank Station and multiple stations on Hong Kong's MTR.
Although the first commerical moving walkway was in a Jersey City railroad station, many moving walkways at United States transit stations have either been removed or do not recieve suitable maintence from subway employees.
Our model is designed to test the impact of introducing moving walkways into subway stations and measuring their impact on passenger throughput. Our objective is to create a model that will reduce passenger travel time enough to justify the cost of implementing and maintaining these walkways. We theorize that the introduction of the moving walkways will decrease average total spent by passenegers in subway stations by increasing their movemeent speed, but at the cost of increased maintenece costs incured by the station.
Requirements:
- The model shall decrease average total time passengers spend at the subway station by a minimum of 10%.
- The total cost of the system shall be within the budget of the station.
- Object Diagram - provides the high level overview of components
- Class Diagram - provides details of (what are you providing details of)
- Behavior Diagram - provides details of (what are you providing details of)
We plan to simulate this model using Python. We have chosen this method because recreating our classes and methods in it will be incredibly easy using Python's expansive user created libraries and tool kits. The simulation will be a discrete simulation depicting passenger objects transitions between states of walking on walkways, walking off walkways, being idle, etc...
To help define a set of requirements and identify how our model can be tested and improved, we have decided to break it down into seperate groups of inputs and outputs. We plan to test a variety of different walkway and passeneger configurations to reached our desired outcome.
Inputs:
- Number of passengers
- Passenger routes
- Moving walkway positions
- Number of moving walkways
- Length of moving walkways
- Width of moving walkways
- Speed of moving walkways
- Moving walkway style (is the right side reserved for standing?)
Outputs:
- Total time spent by passengers by route
- Total cost of implementation
Code - Starting coding framework for the Subway Moving Walkway Model.
To create an accurate and effective model, we must implement real world data. We could manually collect data by tracking information a particular subway station. This can include the paths the passengers take, passenger quantity at different times of the day, and travel length of the different routes. If possible, we could use data colleted during previous studies or just look at the general flow of the population in the city the station is located in. Looking at mean travel times would be ideal as it can be easily measured and useful in determining how effective our model actually is at reducing travel time.
Visualization of our model would be helpful, but the most important part is the data regarding travel times. We could create a Python GUI or 3D simulation showing passengers moving around if it was deemed essential. A more effective means of determining our model's usefullness would be through visualization of data using graphs. Line, scatter, or raincloud plots could show the movement time reduction of different configurations of the system along with that configuration's cost of implementation. When the most efficient and effective walkway configuration is found, an infographic could be created to show the population how it would reduce travel time and what it would look like when implemented.
Independant Variables:
- Passengers
- Quantity
- Route traveled
- Speed
- Walkways
- Quantity
- Length
- Width
- Speed
- Style
Dependant Variables:
- Cost of implementation
- Total travel time for passenegers
Here we provide an overview of the Portable Organic Trouble-free Self-watering System (POTS) Model and provide a source code template for the code found in the following folder.
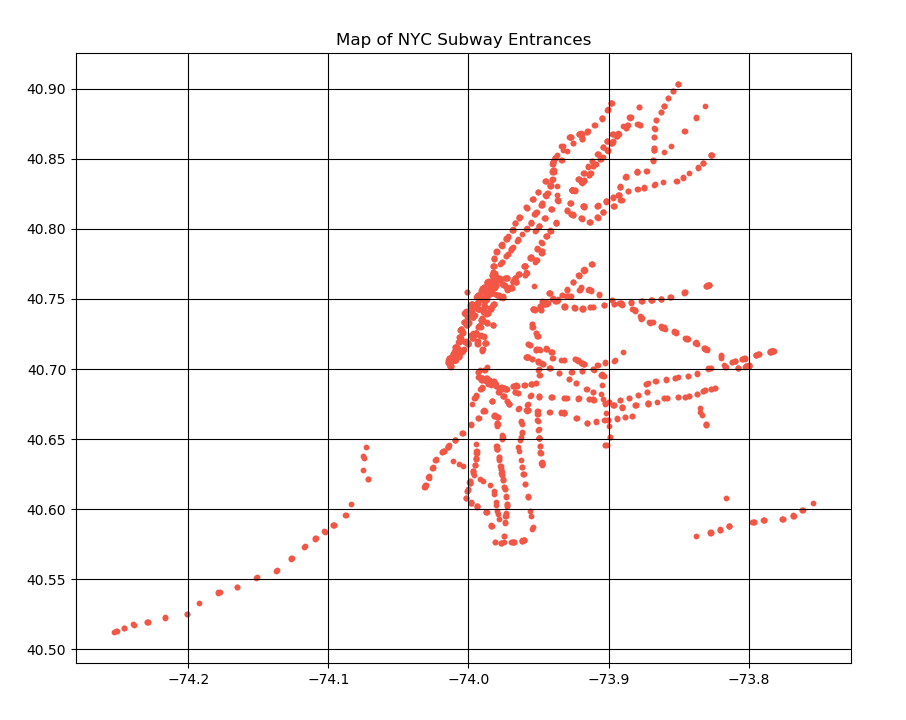
To help track the routes of passengers, we have decided to use data describing the latitude and longitude of all subway entrances in New York City, sourced from the link below.
This data is helpful for our model because it will assist us in creating realistic routes that passengers at the subway stations will walk. By making more realistic routes, we can have a more accurate model. We can use statistics to help us determine the distance between these stations and other variables that will help us create more useful walkways.
To analyze and plot this data, we have created a Python script titled DataReader.py. Running this script's main() will read in the subway data, print the statistics listed below to the console, and generate the top down lat-long plot.
Standard Deviation
X:  0.06584022229371969
Y:  0.0746605793776825
Mean
X:  -73.9488611090275
Y:  40.730016365843106
Median
X:  -73.96009749985149
Y:  40.731125501136546
- Data Source: https://catalog.data.gov/dataset/subway-entrances
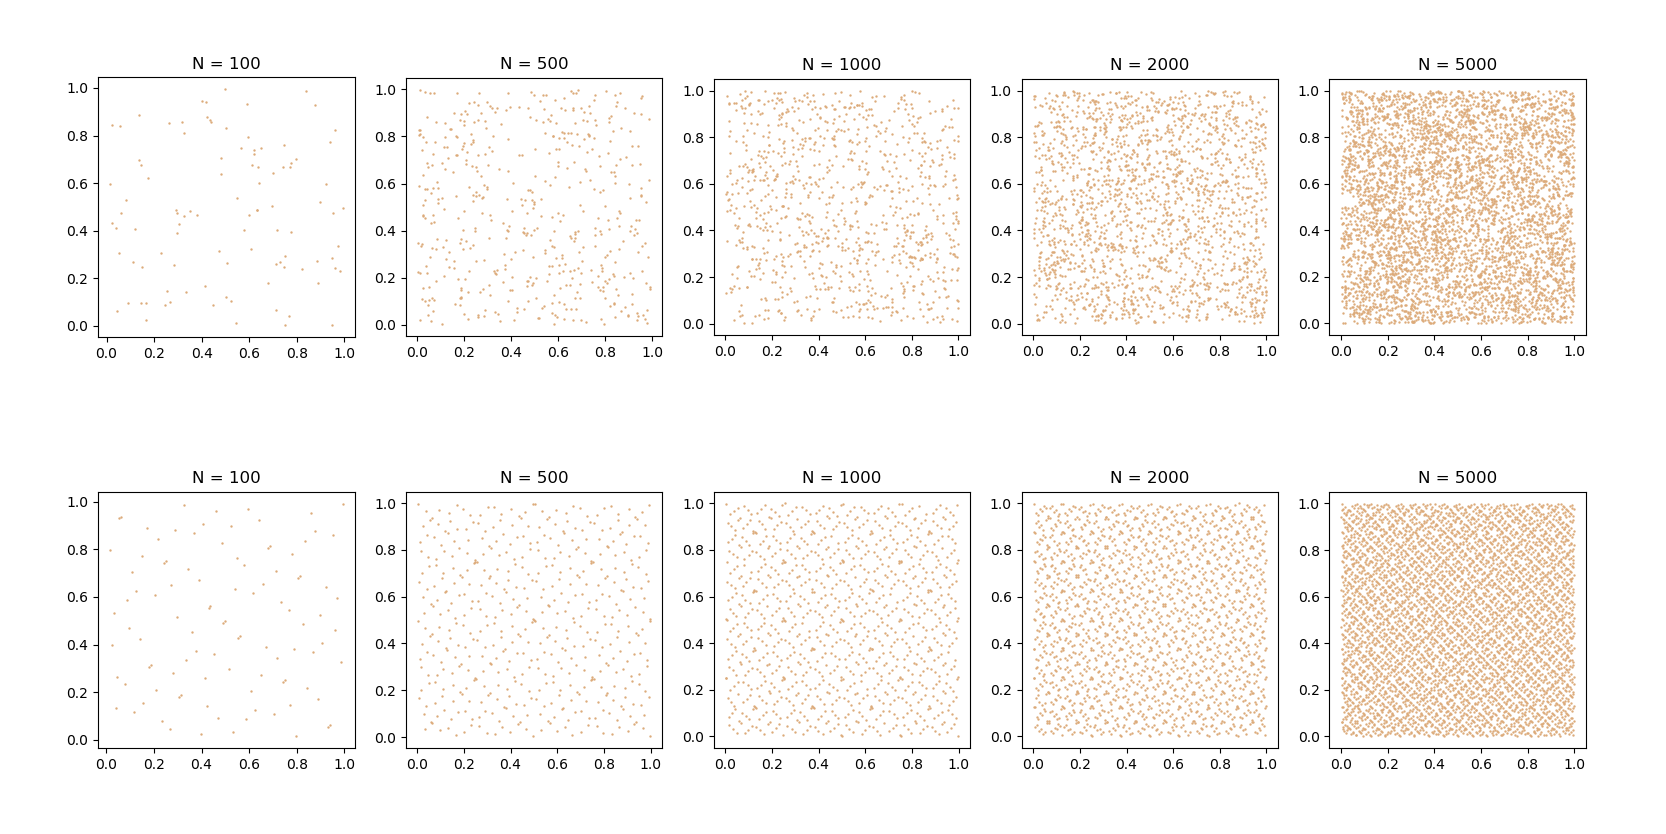
The top row shows the psuedo random number sand the bottom shows the quasi random numbers. The psuedo random numbers were generated using numpy's rand() function, and the quasi random numbers were generated using Sobol Sequences from the library linked below. The most notable difference between the two methods is the clear pattern exhibited by the quasi random method. The sequence has an almost intentional textured look, while the psuedo random numbers seem to not follow any set pattern.
- Python Sobol Sequences : https://pypi.org/project/sobol_seq/
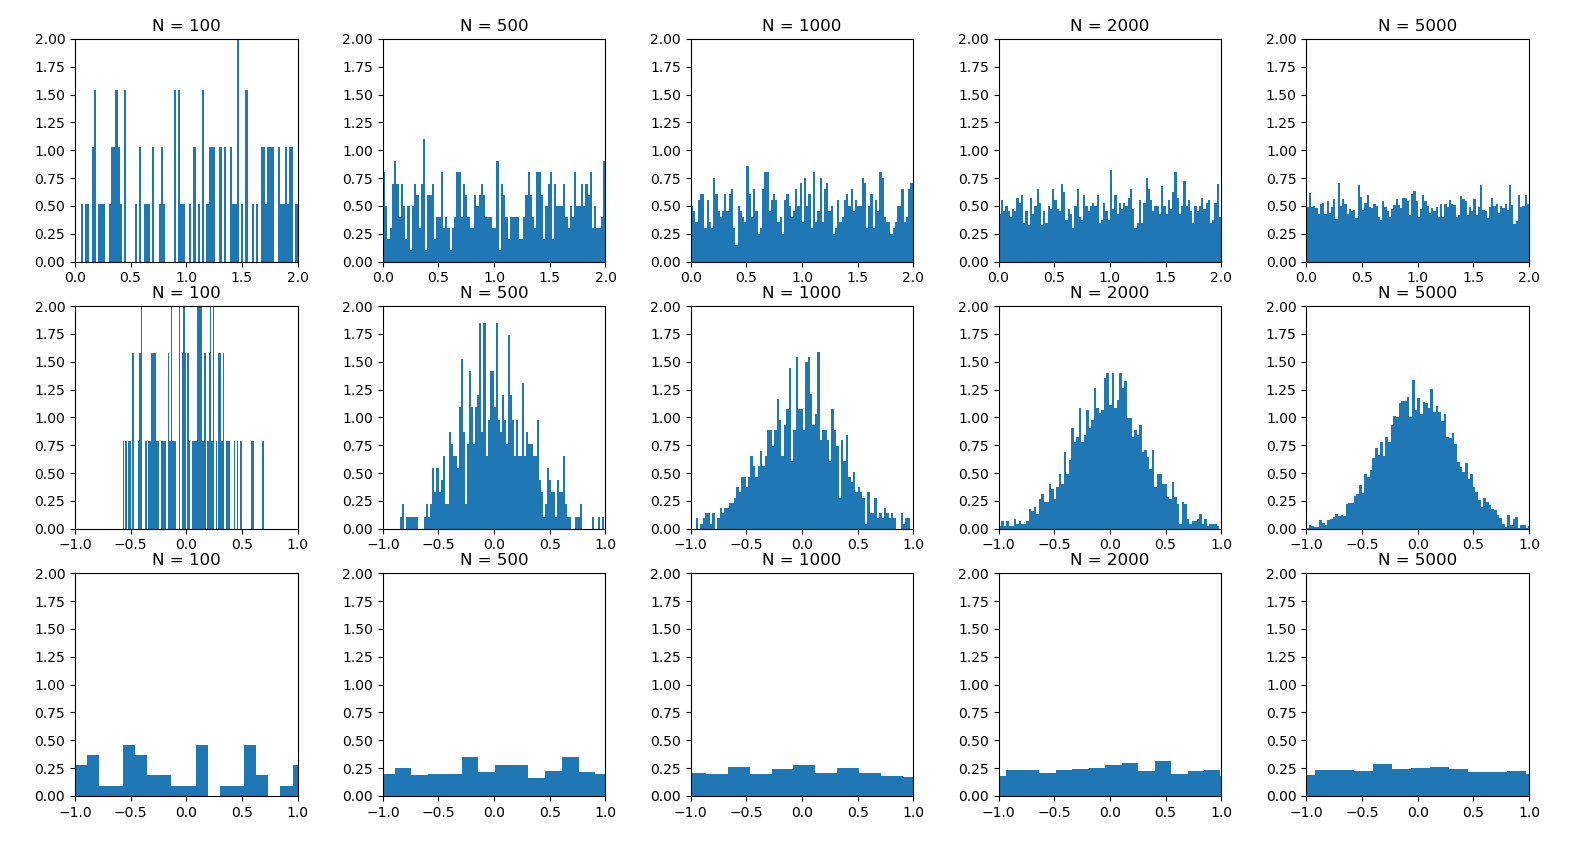
The following graphs were generated using different psuedo random number methods, all taken from the Numpy library. The top row uses Uniform distribution, the middle Normal distribution, and the bottom Logistic distribution. We can see that as N increases, the graphs increasingly resemble how the distributions are supposed to look. Uniform becomes more equal, Normal becomes more normally distributed, and Logistic becomes more flat.
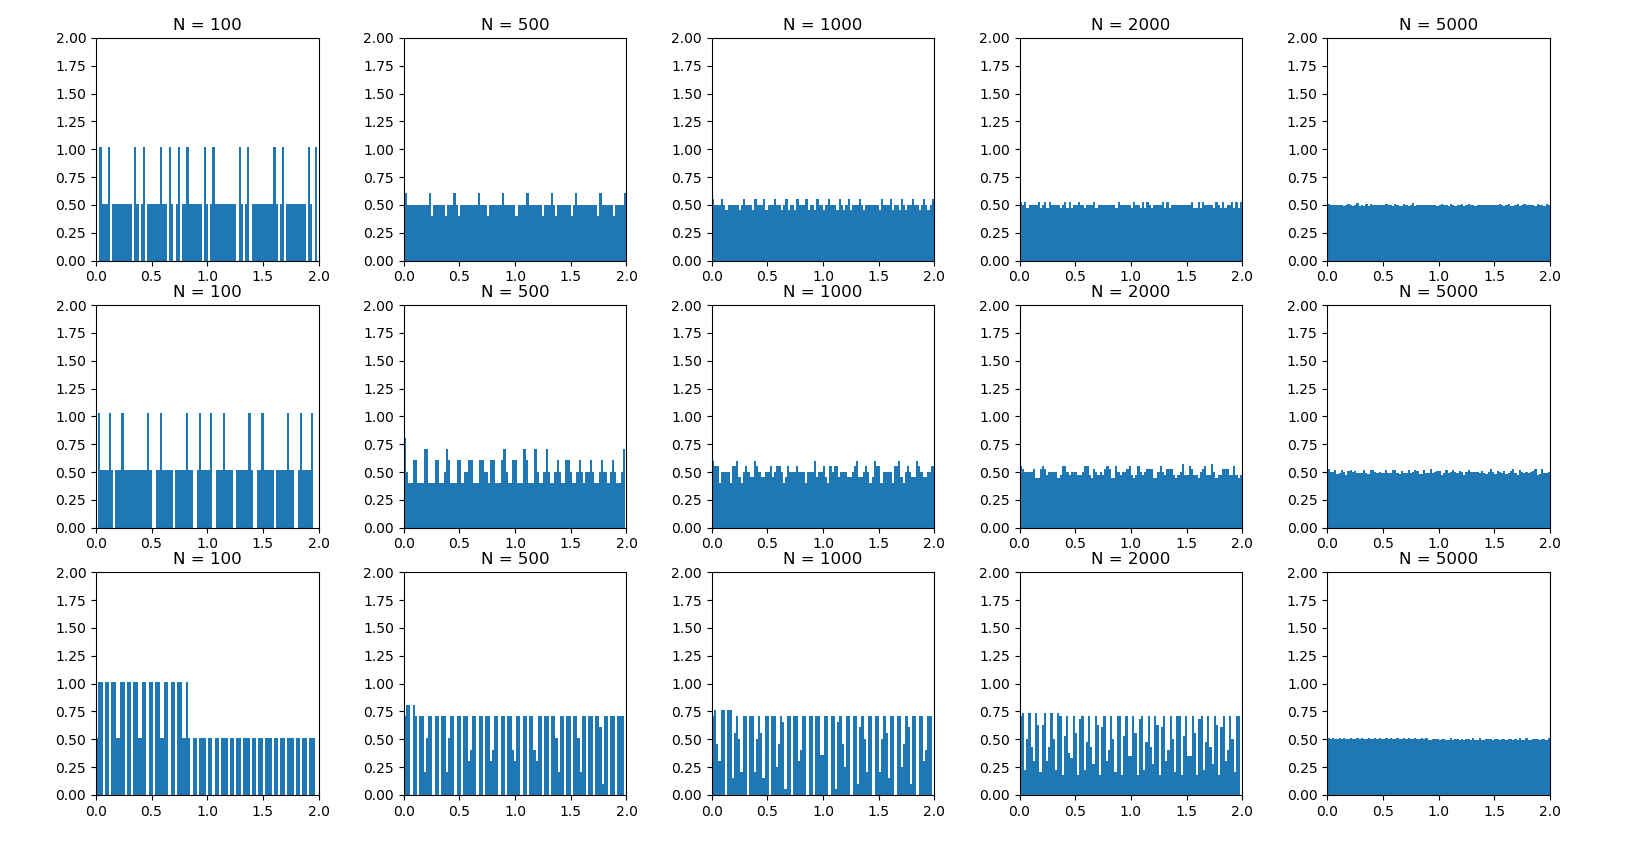
The following graphs were generated using different quasi random number methods. The top row was generated using the Sobol sequence using the same library from part 3.2. The middle row was generated using the Halton, taken from the library below. The bottom row uses the same Halton sequence as the middle row, just using different dimensions. We can see that as N increases, the histograms maintain their quasi random patters, but they become more uniformally distributed.
- Python Sobol Sequences : https://pypi.org/project/sobol_seq/
- Halton Sequence: https://pypi.org/project/ghalton/
Note: Axis labels are a little wonky. The data is legit, but I had to work a little trickery to make the graphs appear square and uniform.
