- Docker
- ELK stack
- Python
- RabbitMQ
- Bash/Shell scripting
To run our project, we're making the assumption you're on linux and have Docker installed. If you're on windows, you can use WSL.
Before running the script, make sure you have a RabbitMQ instance running. If this isn't running yet, you can run the following command:
docker compose -f ./extra/rabbitmq_general_team/docker-compose.yml up -dBefore running any of the next commands, please make sure you're in the /monitoring/Monitoring/src folder (or similar if you have placed the project somewhere else) with the following command:
cd /monitoring/Monitoring/srcTo setup the service for the first time, run the following command:
sudo bash ./main.bash setupTo stop the service, run the following command:
sudo bash ./main.bash stopTo simply start the service, run the following command:
sudo bash ./main.bashFor the manual install guide, please click here.
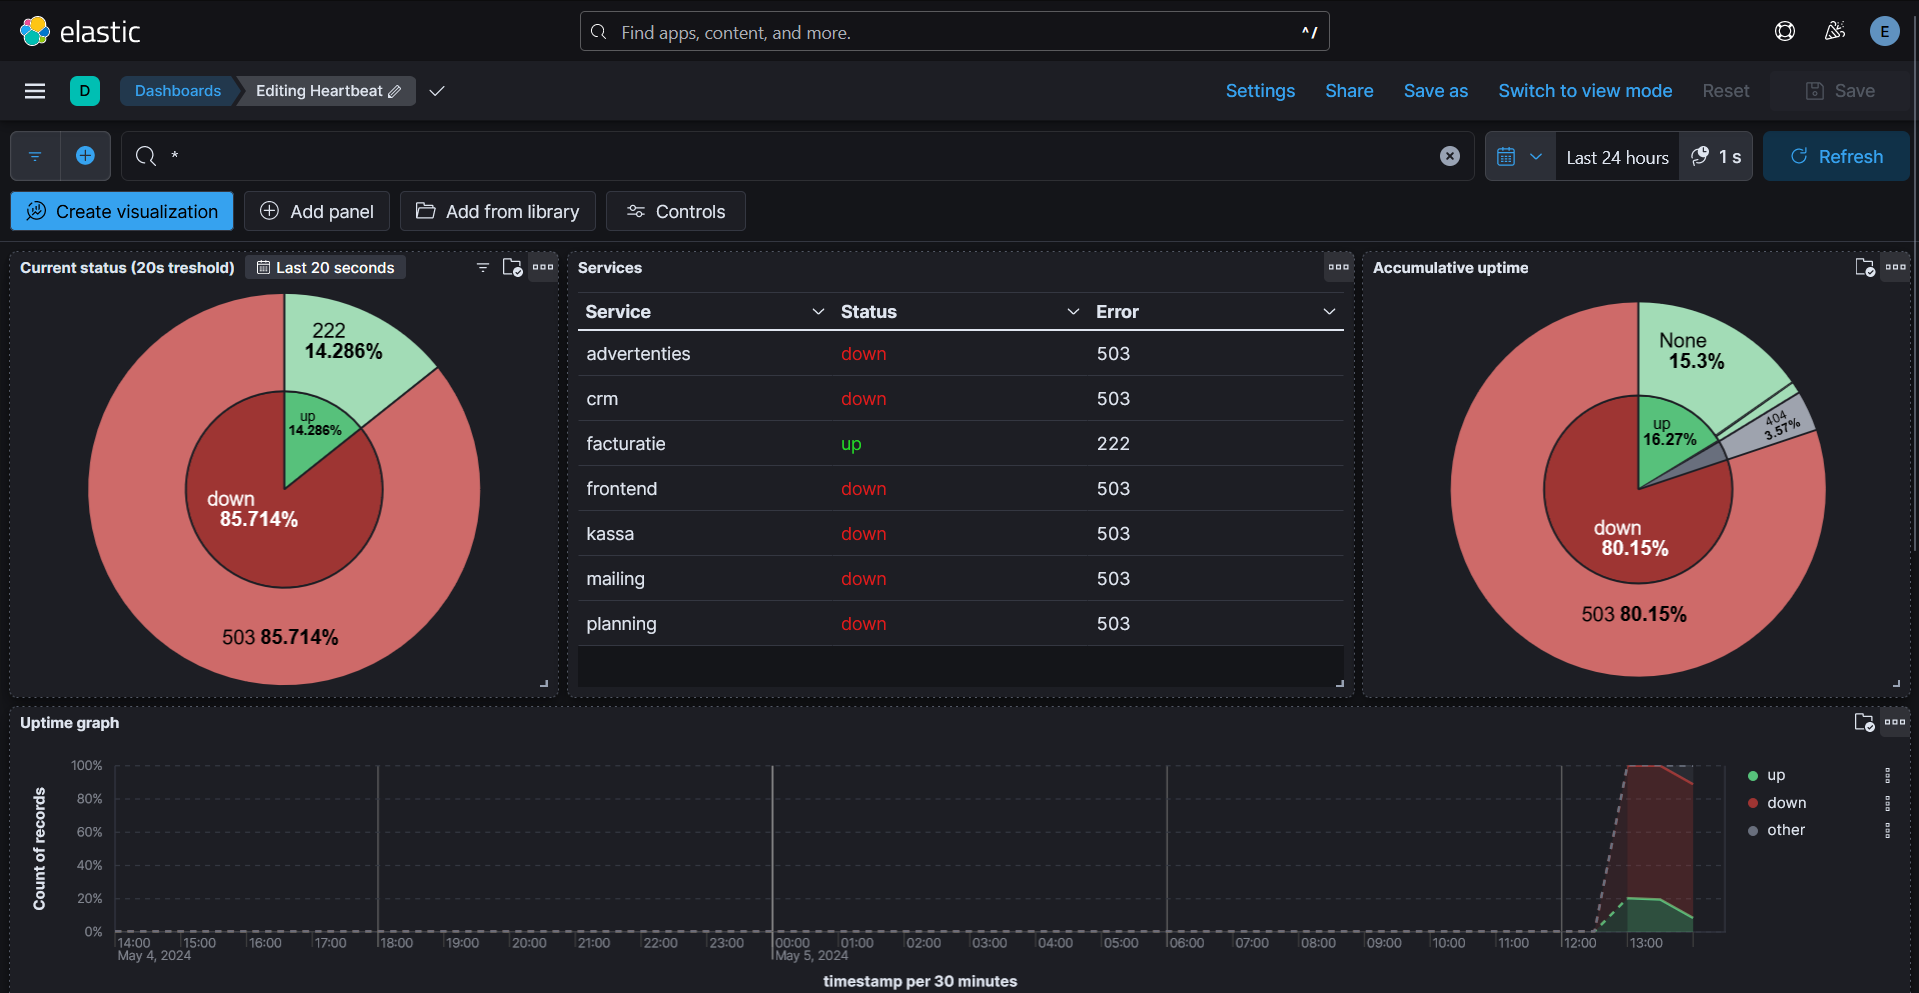
If you'd like to monitor the heartbeats, click here.
If you'd like to add a service to monitor, please follow these steps:
Considering you're still in the ./src folder, run:
cd ./consumerAfter that, you'll be able to edit the csv with a list of service names you want to monitor.
nano ./heartbeat_rabbitmq.csvNotes
- We check for new csv file every minute, consider it may take up to 30 seconds (with both the dashboard and the service set to reload every second) before showing up.
We expect the services to monitor to push the following XSD format to the queue.
You can check the non-kibana logs here
You may need to run the following to fix some permission issues depending on your platform (in the home folder, not src folder):
chmod +rwx ./src/setup/entrypoint.sh
chmod -R 777 ./ELK/elasticsearch/data/
Note the last chmod recursively adds all permissions to everyone. If this is set on a real server with untrusted users, please change this to only give the required permissions.
If you wish to restart from scratch you can:
go into the ./src folder and run the following command:
sudo bash ./main.bash downAnd then delete the volumes with the following command:
sudo rm -rf ../ELK/elasticsearch/data/Now you will only need to change any config file you have changed (like heartbeat_rabbitmq.csv or the export.ndjson) and run the setup:
sudo bash ./main.bash setupNote If you really want to reset everything from scratch including any config files you've changed, you can delete the repo and clone it again (make sure to backup any important files and that everything is down before processing).
If you're using a reverse proxy, keep in mind it should still be on the same network. You could create a new one and add Kibana to it if you wish to do so (if you do end up using one, port 16601 is used for the web interface, feel free to unassign it inside ./src/docker-compose.yml if you use a reverse proxy). Inside the reverse proxy, point it towards this destination: http://kibana:5601/.
Whilst the service is starting up, you may have issues whilst loading the web interface, with random issues popping up that aren't related to what you're doing. To counter this, wait about a minute, then refresh your page.
Note
- You may also want to check tests, or check the container logs with
docker logs <container_id>or portainer. - If you wish to access more website tips, please click here.
If you'd like to verify everything at once, there's a few steps to follow.
You'll first need to enter ./src. To do so, type this in your console:
cd ./srcAfter that, you'll need to run the tests-script.bash file. To do this, execute the following command in your CLI:
sudo bash ./tests-script.bashIn case you'd like to verify the integrity of the docker-compose.yml file, follow the steps below.
If you've never done a docker-compose test, please execute the following command first:
sudo apt install docker-composeNote your packet manager may differ.
Once docker-compose is installed, please run the following command. If the file is good to go, it should return "OK". Else, it'll return "ERROR":
docker-compose config --quiet && printf "OK\n" || printf "ERROR\n"- 5672 (RabbitMQ api)
- 15672 (RabbitMQ frontend)
- 16000 (Portainer, this would typically be 8000)
- 16601 (Kibana, this would typically be 5601)
- 19200 (Elasticsearch API, this would typically be 9200)
- 19300 (Elasticsearch binary protocol, this would typically be 9300)
- 17443 (Portainer https front-end, this would typically be 9443)
Note RabbitMQ doesn't follow the assigned ranges as it's for the general group (can be run from outside) and people were already publishing to those ports.
- Official ELK docs
- Heartbeat installation configuration
- RabbitMQ training course
- No code used but pretty interesting to read: check them out
- Used repo 1 setup script and also inspiration from reading their code base FOLLOW THEIR MIT LICENSE! or BACKUP LINK
- Used repo 2 dashboard resources used form their 7.x dashboard FOLLOW THEIR APACHE LICENSE! or BACKUP LINK
- YTB NetworkChuck tutorial docker
- YTB NetworkChuck tutorial docker compose
- YTB IBM message queue
- YTB IBM RabbitMQ
- YTB ELK tutorial 1 part 1 & YTB ELK guide 1 part 2
- YTB ELK tutorial 2 (french)
