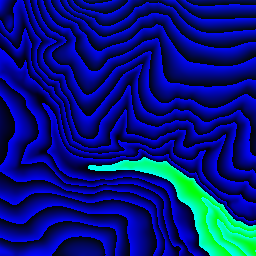
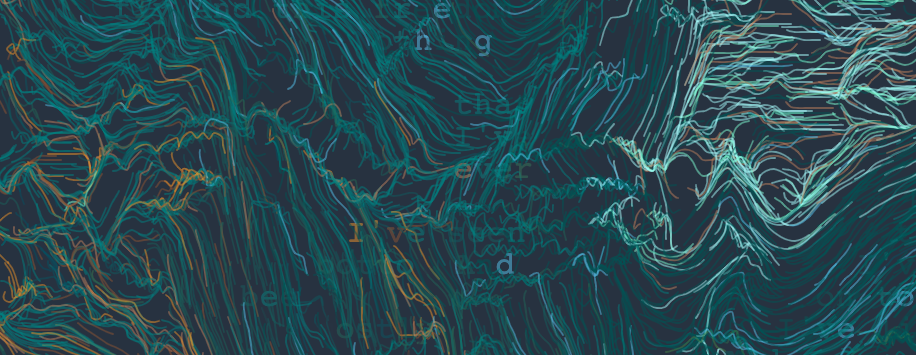
The project was inspired by my sister's love of geology and the great enjoyment I got from working with a student on this tutorial by Tyler Hobbes. I asked if perlin noise is used to model geographies, can geography be used as perlin noise?
I used mapbox terrain-rgb to get precise height values. The mapbox plan is free for the scale of requests I was making, but make sure that you cache responses from their server, or you may run up a bill.
I used geoJson to specify the area I wanted, and @mapbox/cover handled to handle the output.
I covered a large area, so I had to stitch my images together. I ended up using vips arrayjoin "1657x3158.png 1657x3159.png..." result.png --across 9 instead of ImageMagick append, because the later changed my pixel values.
The above code for downloading and stitching is now a little command line tool which is available here.
I also wanted to include a trail system in the map. Shapefiles seem to be lingua franca for this, and it's easy to see why: I had a trail network which was almost 126 mb as json, but as a Shapefile, it was only 33mb. Mapshaper is a good tool to work with shapefiles, allowing you to simplify, convert and annotate them effectively.
My topograph had about 3.5 million pixels, and I needed the height, slope, and aspect for each of them. Luckily, GPU.js allowed me to throw these calculations onto the GPU which sped things up considerably.
const gpu = new GPU();
const toHeights = gpu
  .createKernel(function hmap(data, width) {
    const { x, y } = this.thread;

    const start = y * (width * 4) + x * 4;
    const [R, G, B, A] = [
      data[start],
      data[start + 1],
      data[start + 2],
      data[start + 3],
    ];
    return -10000 + (R * 256 * 256 + G * 256 + B) * 0.1;
  })
  .setPipeline(true)
  .setDynamicOutput(true);
With very large files, my GPU memory flopped. To fix it, I had to slice the image data.
const nSlices = 4;
const step = height / nSlices;
const slices = times(nSlices, (i) =>
  data.slice(i * step * width * 4, (i + 1) * step * width * nSlices)
).map((data) => {
  const htex = toHeights.setOutput([width, step])(data, width);
  const pixels = slope.setOutput([width, step])(htex, pixDist);
  const extremay = extrema_y.setOutput([step])(htex, step);
  const [min, max] = extremay.reduce(([min, max], [mi, ma]) => {
    return [Math.min(mi, min), Math.max(ma, max)];
  });
  return {
    min,
    max,
    magnitude: max - min,
    pixels,
    width,
    height,
  };
});The final image was created using p5.js. Though the process image code hasn't been put in a separate library, it is somewhat reusable. The rest of the code isn't terribly reusable (or well written) but I hope that it can serve as an example for other artists.


