The implementation of scanning radar scan matching proposed in "A Normal Distribution Transform-Based Radar Odometry Designed For Scanning and Automotive Radars " , accepted for publication in the IEEE ICRA 2021. This repo is a ROS package. Please place it in a catkin workspace to build and run the code.
The result of this code is not the same as the original paper because we change the optimization method in NDT to improve the robustness of scan matching. The PW-NDT can now be used without failure detection based on vehicle acceleration constrain. Therefore, the code we provided has removed the complex rule for failure detection used in the origin paper.
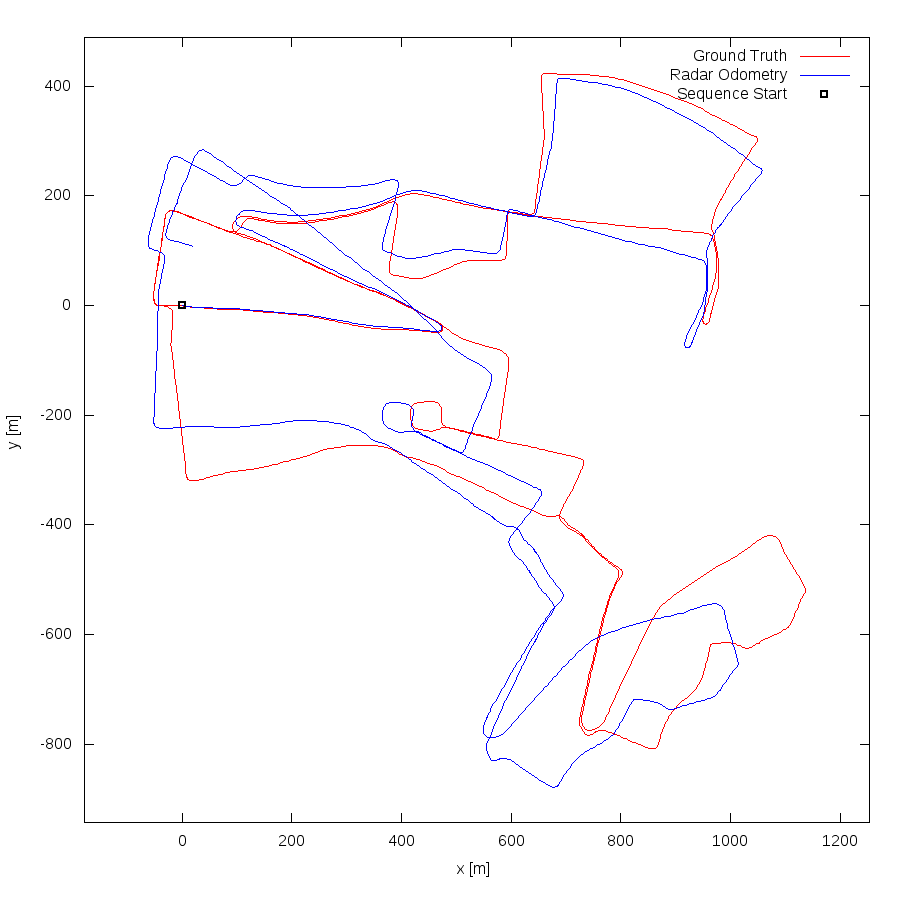
Radar Odometry Path:
Ubuntu 16
ROS Kinetic
OpenCV 3.3.1
C++14
Python2.7
You can download the dataset from: https://oxford-robotics-institute.github.io/radar-robotcar-dataset/
Replace 'path' in script/oxford_gen_gt_file.py with the path of your dataset. The directory of the path should be like the following structure.
--- 2019-01-10-11-46-21-radar-oxford-10k
|   |_ gps
|   |_ gt
|   |_ radar
---  2019-01-10-12-32-52-radar-oxford-10k
|   |_ gps
|   |_ gt
|   |_ radar
Then run:
$ python script/radar_polar_to_cart_png.py
Replace the oxford_data_path in script/oxford_gen_gt_file.py file, then run:
$ python script/oxford_gen_gt_file.py
$ cd ..
$ catkin build pw_ndt_radar_scan_matching
Replace parameters: /directory, /gt_directory, and /save_directory in src/radar_odometry.launch file with your path.
/directory: path of data
/gt_directory: path of ground truth file
/save_directory: path to save result
Run the code:
$ roslaunch pw_ndt_radar_scan_matching radar_odometry.launch
You should see something like the following:
-----------------------------------
[Index]: 2714 t:678.168
 [NDT] iterations: 56 final eps_: 0.00198111
 [NDT] iterations: 4 final eps_: 0.0022713
 [NDT] iterations: 6 final eps_: 0.000162936
 [RES]  xytheta: -1.49466 -0.0464338 0.179704
 vel: 5.9713 ang_vel: -0.717225  acc: -0.570943 ang_acc: -1.37748
 [GT]  xytheta: -1.50665 -0.00923157 0.132421
 vel: 6.01644 ang_vel: -0.52851  acc: -0.390686 ang_acc: -0.623908
 [ERROR] xytheta: 0.0119975 m 0.0372023 m 0.0472834 deg
-----------------------------------
[Index]: 2715 t:678.418
 [NDT] iterations: 52 final eps_: 0.00183574
 [NDT] iterations: 2 final eps_: 0.00178275
 [NDT] iterations: 9 final eps_: 0.000184919
 [RES]  xytheta: -1.46033 -0.0446452 0.19211
 vel: 5.84119 ang_vel: -0.767677  acc: -0.520185 ang_acc: -0.201709
 [GT]  xytheta: -1.45605 -0.00511169 0.0686752
 vel: 5.82141 ang_vel: -0.274428  acc: -0.599263 ang_acc: 1.77033
 [ERROR] xytheta: 0.00427389 m 0.0395335 m 0.123435 deg
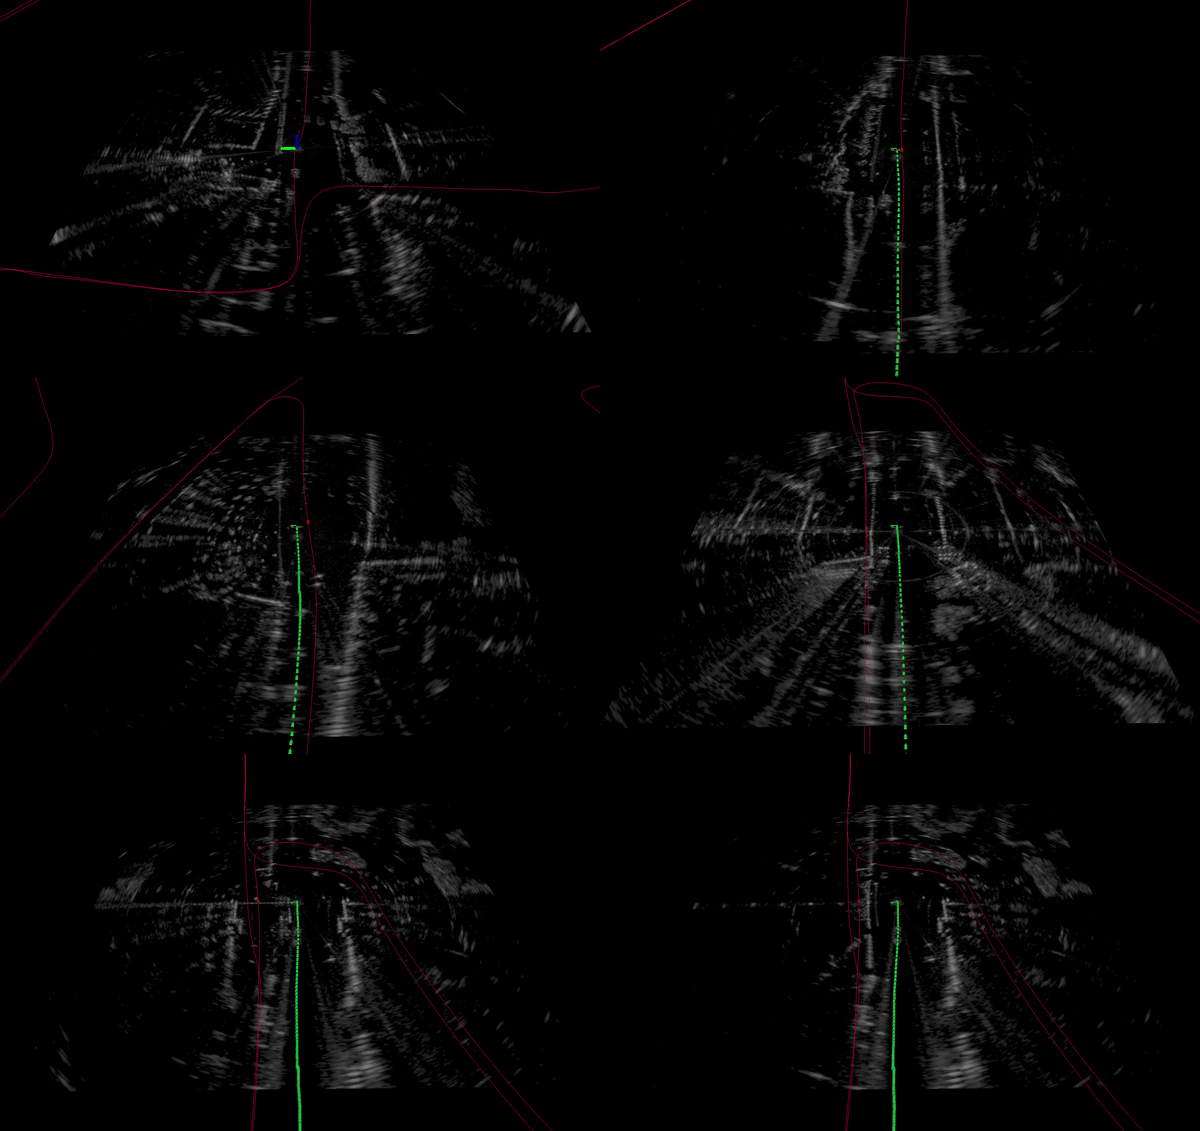
$ rosrun rviz rviz -d config/rviz_config.rviz
Topics:
/radar_odometry/radar_odometry/vis/gt_path (nav_msgs::Path) => ground truth path
/radar_odometry/radar_odometry/vis/gt_pose (nav_msgs::Odometry) => ground truth odometry
/radar_odometry/radar_odometry/vis/res_pose (nav_msgs::Odometry) => odometry result
/radar_odometry/radar_odometry/vis/ndmap (visualization_msgs::MarkerArray) => normal distribution map
/radar_odometry/radar_odometry/vis/new_pc (sensor_msgs::PointCloud2) => current point cloud (t)
/radar_odometry/radar_odometry/vis/old_pc (sensor_msgs::PointCloud2) => old point cloud (t-1)
/radar_odometry/radar_odometry/vis/out_pc (sensor_msgs::PointCloud2) => transformed point cloud
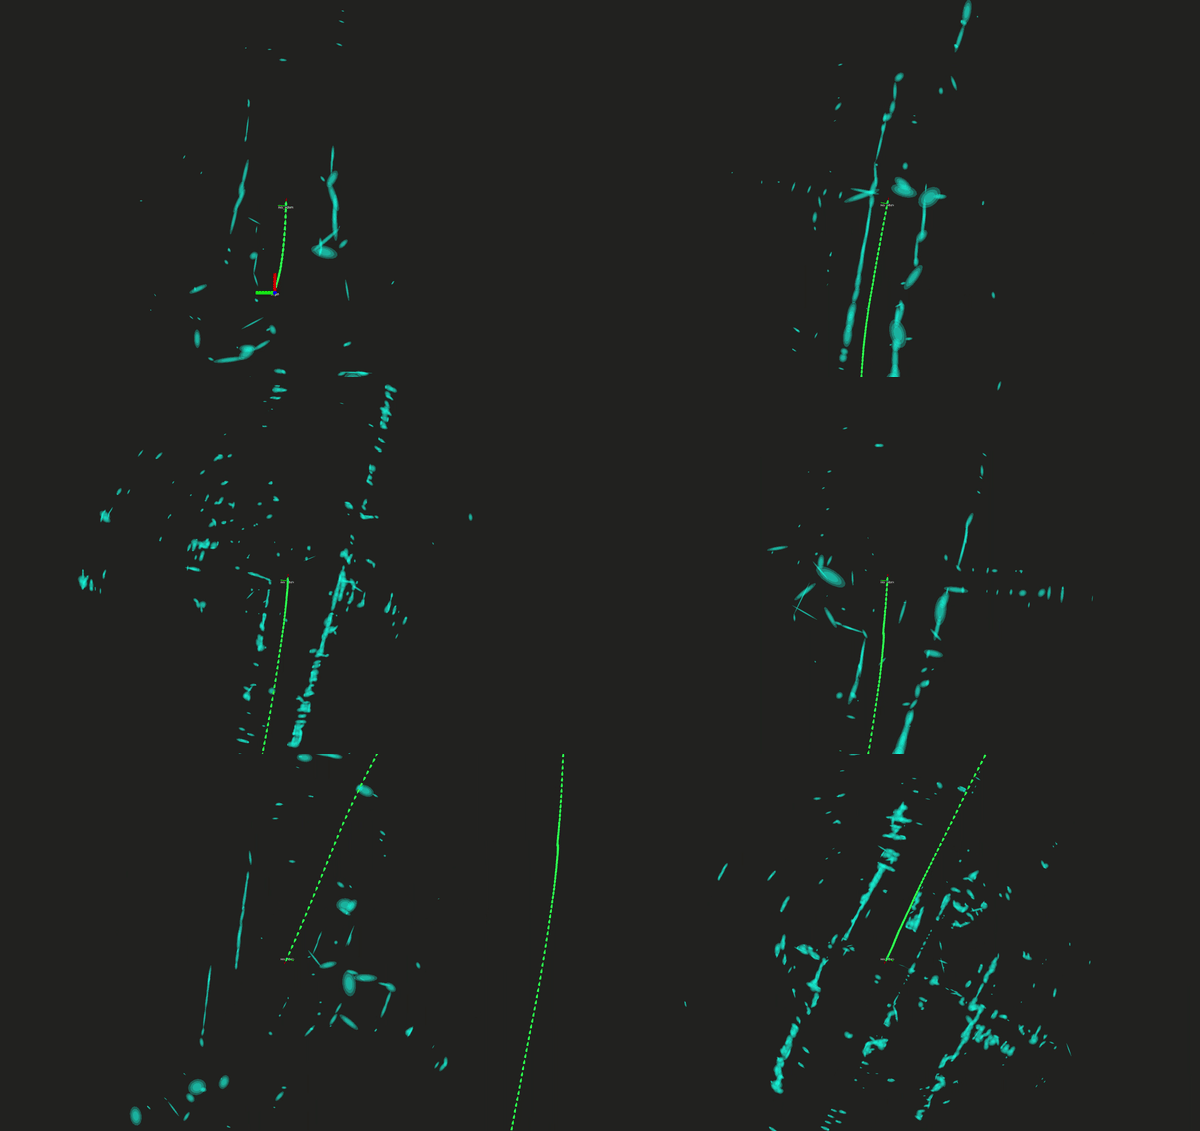
Normal Distribution Map Visualization:
with all ground truth files in './kitti_eval/devkit_for_oxford/cpp/data/odometry/poses' and result files in './kitti_eval/devkit_for_oxford/cpp/results/result/data' run following commands to evaluate the odometry performance.
$ cd kitti_eval/devkit_for_oxford/cpp
$ g++ -O3 -DNDEBUG -o evaluate_odometry evaluate_odometry.cpp matrix.cpp
$ ./evaluate_odometry result
You will see the result with number in stats.txt and plot in /plot_path


